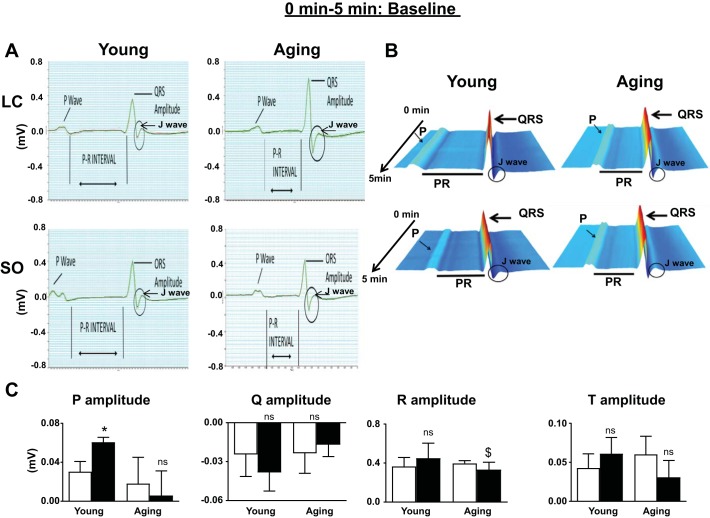
Fig. 2.
ECGs from young and aging mice fed with standard laboratory chow (LC) or excess ω-6 diet. A: ECG analyses displaying the change in QRS amplitude. B: waterfall plots displaying the changes in ECG traces from 0 to 5 min. C: bar graph of P, Q, R, and T amplitude from ECG traces of young and aging mice fed with standard LC or ω-6-enriched diet. ECGs were recorded after stabilizing mice for 5 min at room temperature. Values are means ± SE; n = 8 mice/group. *P < 0.05 vs. the young-LC group; $P < 0.05 vs. the aging-LC group; ns, not significant as analyzed by two-way ANOVA.

