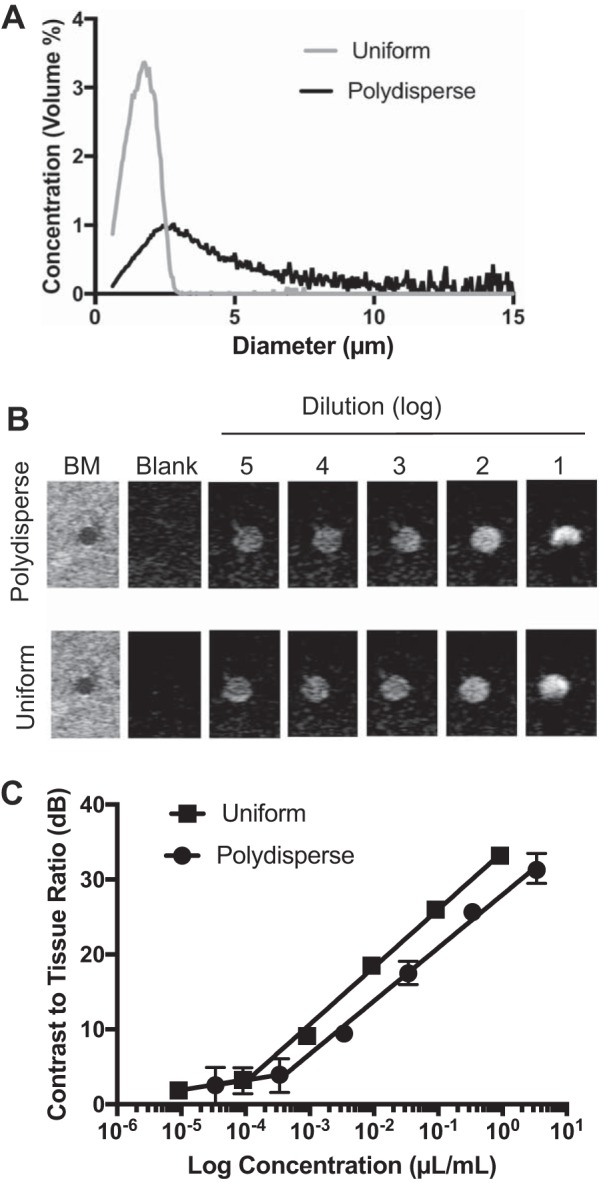
Fig. 1.

Comparison of in vitro echogenicity of uniform and polydisperse microbubble formulations. A: relative size distributions of standard polydisperse (black line) and uniformly size-tuned (gray line) microbubble products. B: representative ultrasound images for each microbubble product. The first image in each set is a B-mode (BM) of the phantom, and subsequent images are contrast images for serial dilutions. C: contrast-to-tissue ratio as a function of microbubble volume concentration. Lines represent linear fit, and error bars represent range over n = 3 repeated measurements/data point.
