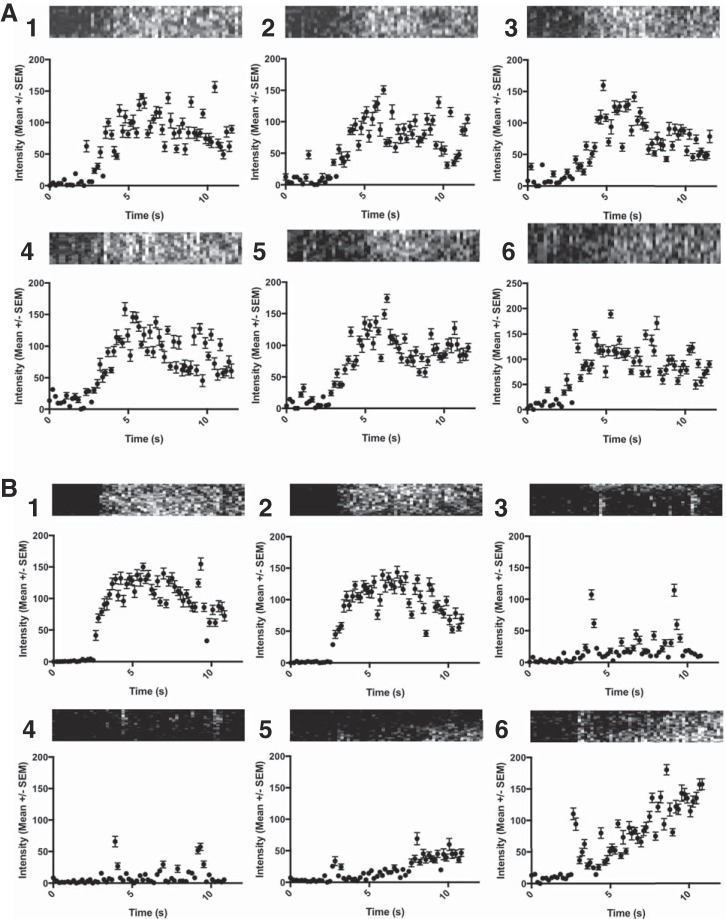
Fig. 5.
Time-intensity curves derived for the control (A) and infarcted (B) mice examined in Fig. 4. The linear myocardium ROI was divided into 6 segments of equal length, labeled as 1–6. Data are presented as mean intensities ± SE within the ROI. Reslice images representing the portion of myocardium contained in each segment are presented above each curve.

