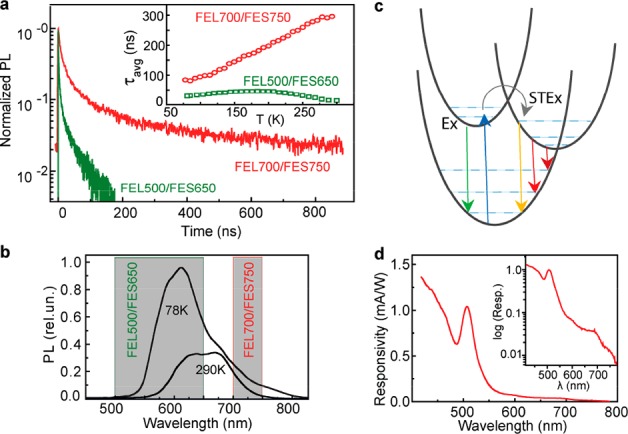
Figure 4.

(a) RT time-resolved PL traces recorded in two spectral ranges (indicated in panel b) : 500–650 nm (green) and 700–750 nm (red). Inset: temperature-dependence of the average PL lifetime. (c) Configuration coordinate diagram for free excitons and STEx. (d) Photoconductivity spectrum from a single FAGPbI4 crystal.
