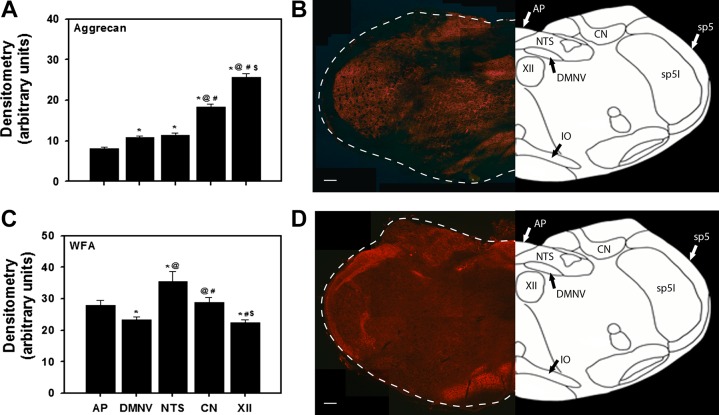
Fig. 8.
A and C: aggrecan and WFA immunoreactivity showing relative expression across various brain regions in P15 normoxic rats. Values are means ± SE; n = 8. *P < 0.05 vs. AP; @P < 0.05 vs. DMNV; #P < 0.05 vs. nTS; $P < 0.05 vs. CN (by 1-way ANOVA). B and D: representative images from single rats. AP, area postrema; DMNV, dorsal motor nucleus of the vagus; nTS, nucleus tractus solitarius; CN, cuneate nucleus; XII, hypoglossal motor nucleus; IO, inferior olive; sp5, spinal trigeminal tract; sp5I, spinal 5 interpolar. Scale bar = 200 μm.

