Fig. 1.
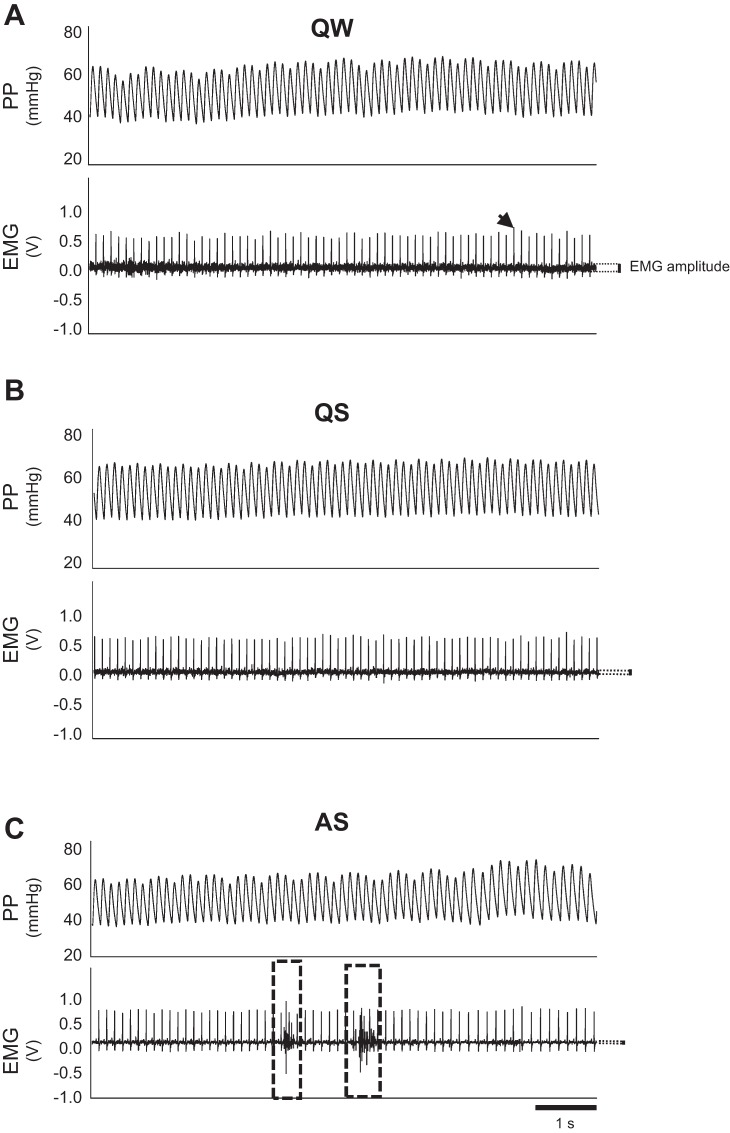
Arterial pulse pressure (PP) and nuchal electromyographic (EMG) records obtained from short periods of quiet wakefulness (QW, A), quiet sleep (QS, B), and active sleep (AS, C). Amplitude of nuchal EMG record (dark black section of trace) is indicated by dotted lines with the black vertical bar. When compared with QW, EMG amplitude is lower in QS and is reduced further in AS. During AS, burst of activity associated with myoclonic twitching appears in the EMG record (dashed boxed regions). Nuchal EMG is superimposed on higher amplitude R-waves of the electrocardiographic record (indicated by arrowhead).

