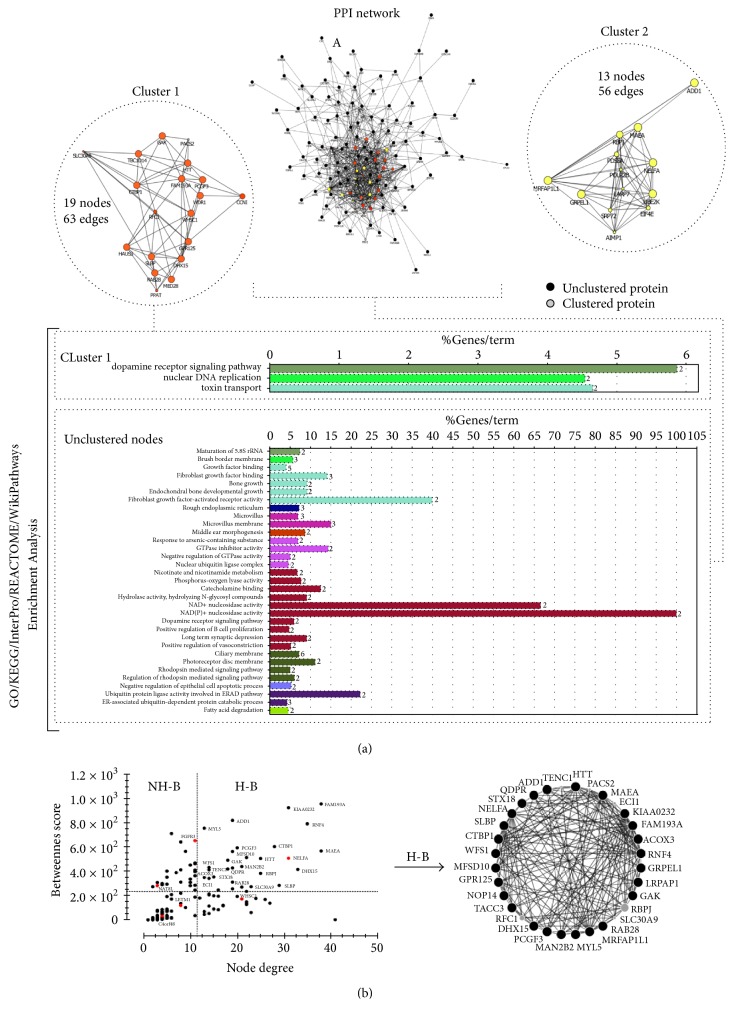
Figure 4.
Graphs representing protein-protein interactions (PPI) network. (a) List of 343 genes was obtained from GENCODE V24-GRCh38/hg38-UCSC database. The data was used to construct networks using Cytoscape software processing. (b) Centralities parameters and topological analysis, using the CentiScaPe plugin; genes in small region overlapping (SRO) in our study are in red.

