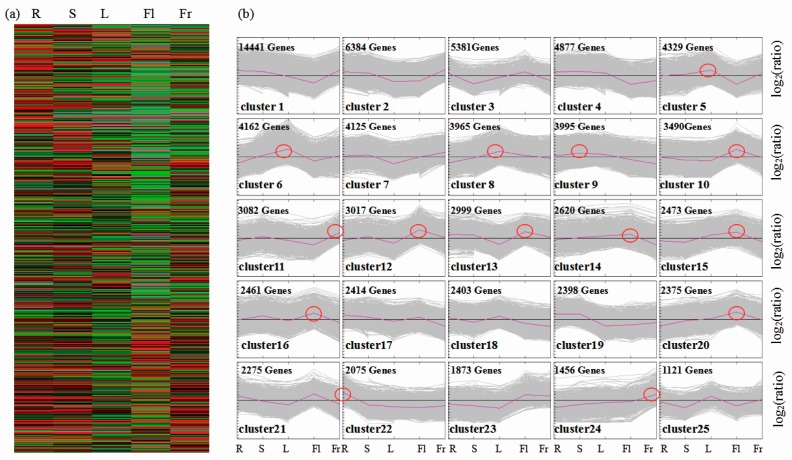
Figure 3.
Transcriptional variation between five different organs of okra. (a) Expression profiles of the differentially expressed unigenes (DEGs) between five different organs are illustrated by a heatmap. (b) Cluster analysis by the K-means method from the gene expression profiles. Red circles indicated the organ-specific expressed genes.

