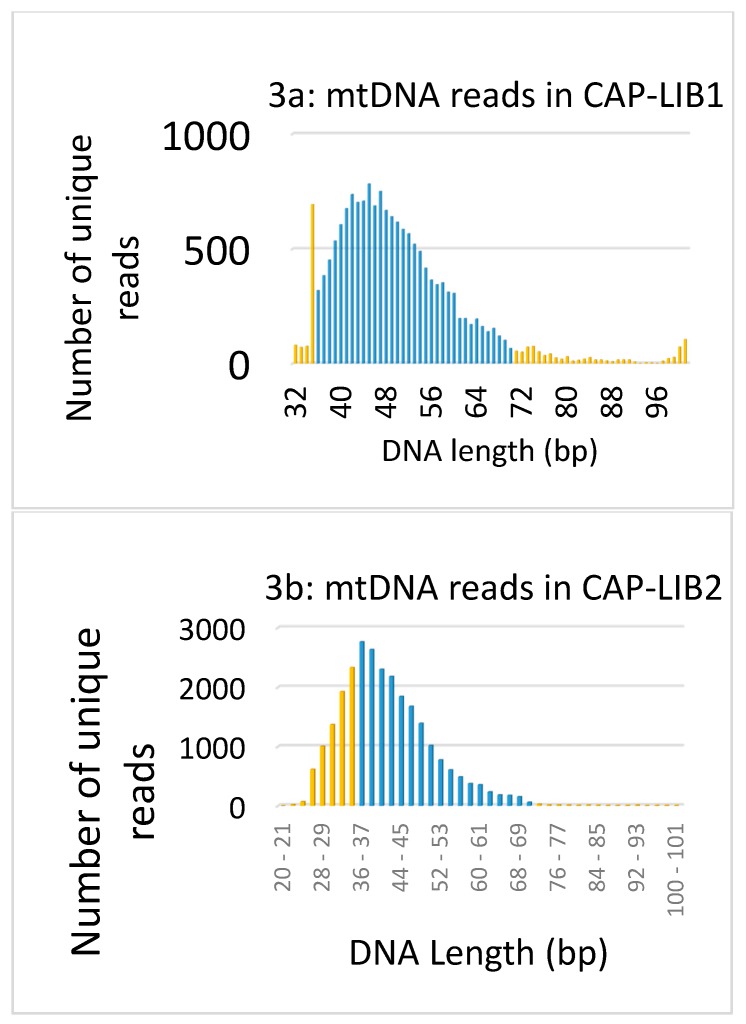
Figure 3.
(a) Size distribution of the reads that aligned to the mtGenome in CAP-LIB1. Reads ≤35 bp or >70 bp (shown in orange) were removed from the final data to avoid any impact from nonspecific [34] or contaminating reads. The length with the greatest number of reads was 47 bp. (b) Size distribution of the reads that aligned to the mtGenome in CAP-LIB2. Only reads >35bp and ≤70 bp (shown in blue) were retained in the final data. The length with the greatest number of reads was 38 bp.

