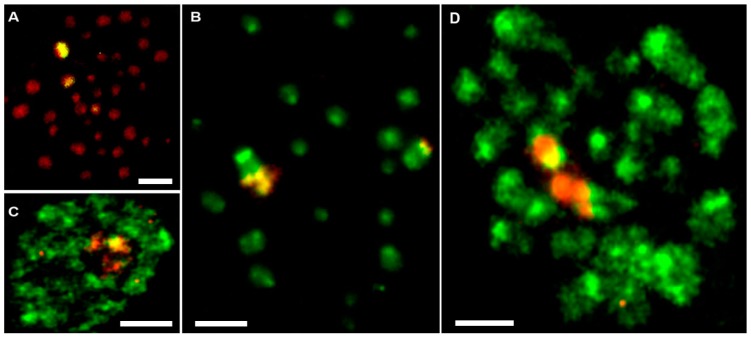
Figure 6.
Fluorescence in situ hybridization (FISH) with the 28S rDNA probe and interspecies CGH results visualizing rDNA regions. (A) 28S rDNA FISH to E. virens chromosomes (red) showing three hybridization signals (yellow); (B) 28S rDNA FISH to chromosomes of H. incongruens (green) with three hybridization signals (yellow); (C) interspecies CGH experiments between E. virens (red, whole-genome DNA) and H. incongruens (green, nucleus and DNA) showing the red signal in the nucleolar region; (D) reciprocal CGH experiment to C/on E. virens chromosomes (green) with a whole-genome DNA probe of H. incongruens. Scale bars indicate 3 µm.

