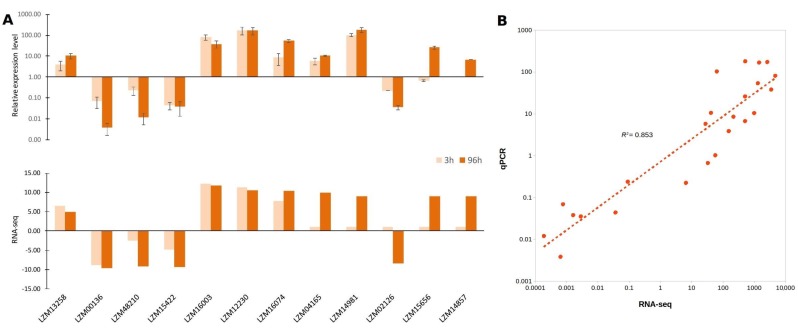
Figure 6.
Validation of RNA sequening (RNA-seq) results by reverse transcription-quantitative PCR (RT-qPCR) of the differentially expressed lncRNAs in response to salt and boron stress. (A) Comparisons between qPCR validation, compared to RNA-seq. The upper graphic represents the differential expression analysis of 10 leaves and 2 roots randomly selected lncRNAs at 3 and 96 h after exposure to 150 mM NaCl and 20 ppm B stress conditions obtained by RT-qPCR. The lower graphic represents the fold changes based on FPKM calculated from globally normalized RNA-seq data. For RT-qPCR, the Cullin gene was used on the normalization of gene expression. The values are presented as an average and standard error (SE) of three independent experiments, with three technical replicates; (B) Correlation analysis according to qPCR and RNA-seq assays.

