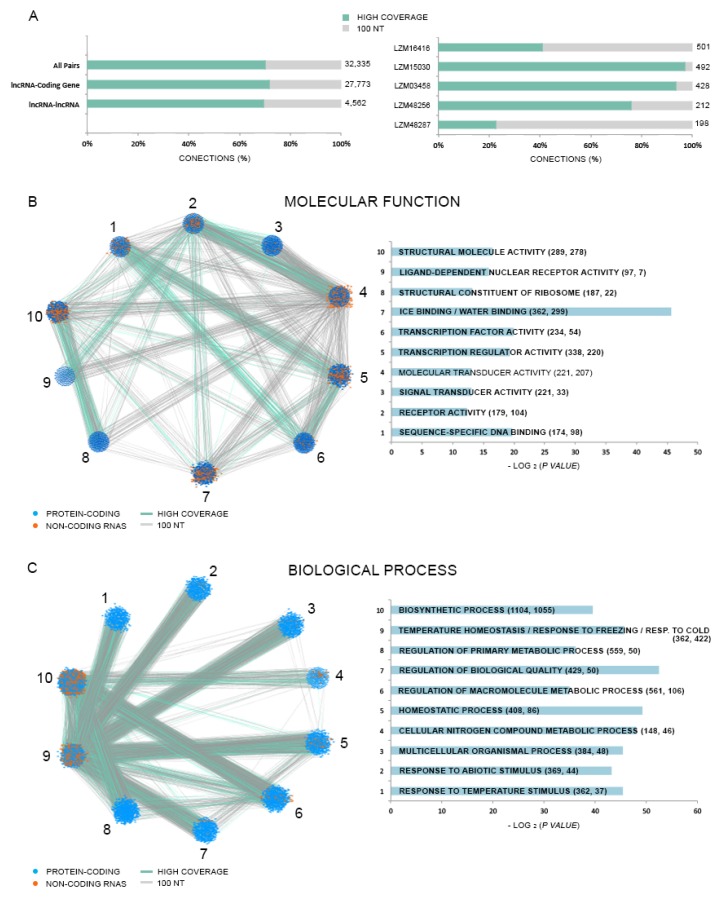
Figure 7.
(A) On the left, we have the distribution of trans natural transcript (trans-NAT) pairs according to its classification (high-coverage or 100 nt), and the target transcripts type (coding genes or lncRNAs). On the right, we have the top five lncRNAs with the most target transcripts; (B,C) Network and histogram of the top ten ‘molecular function’ and ‘biological process’ enriched Gene Ontology (GO) categories, respectively.

