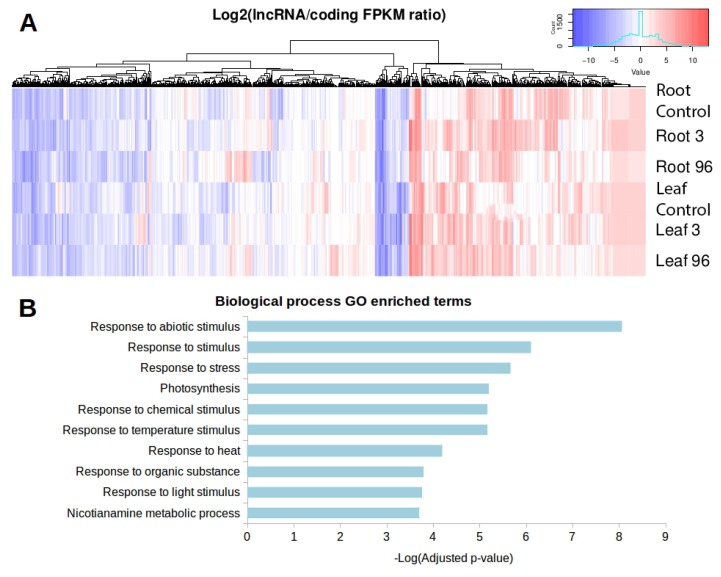
Figure 8.
(A) Heat map representation of the expression ratio between differentially expressed trans-NAT lncRNAs and their respective target coding gene. In red, we have the pairs in which the lncRNA is overexpressed compared to their paired coding gene. In blue, the coding genes are overexpressed compared to their paired lncRNA; (B) ‘Biological process’ Gene Ontology enriched categories of differentially expressed trans-NAT lncRNAs.

