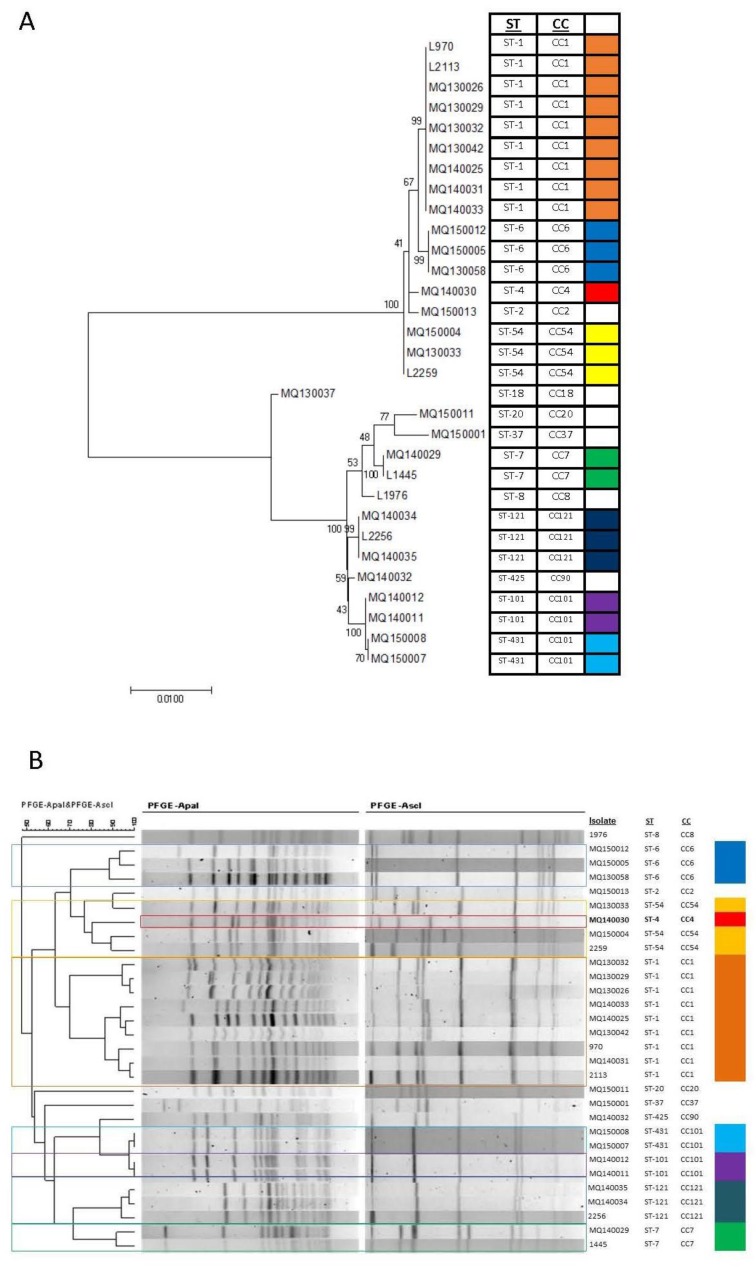
Figure 1.
(A) Clustering of isolates based upon multi-locus sequence typing (MLST). The evolutionary history was inferred by using the Maximum Likelihood method based on the Tamura 3-parameter model [30] as outlined in detail in Materials and Methods. The tree with the highest log likelihood (−5971.3729) is shown. The percentage of trees in which the associated taxa clustered together is shown next to the branches. The tree is drawn to scale, with branch lengths measured in the number of substitutions per site. Evolutionary analyses were conducted in MEGA7 [31]; (B) Clustering of isolates based upon pulsed field gel electrophoresis (PFGE). Dendograms were generated with BioNumerics v7.0 software (Applied Maths) using UPGMA (unweighted pair group method with averages) and the Pearson coefficient with 1% tolerance. Using either method (MLST or PFGE) strains cluster into two distinct groups dependent upon lineage. ST: sequence type; CC: clonal complex.

