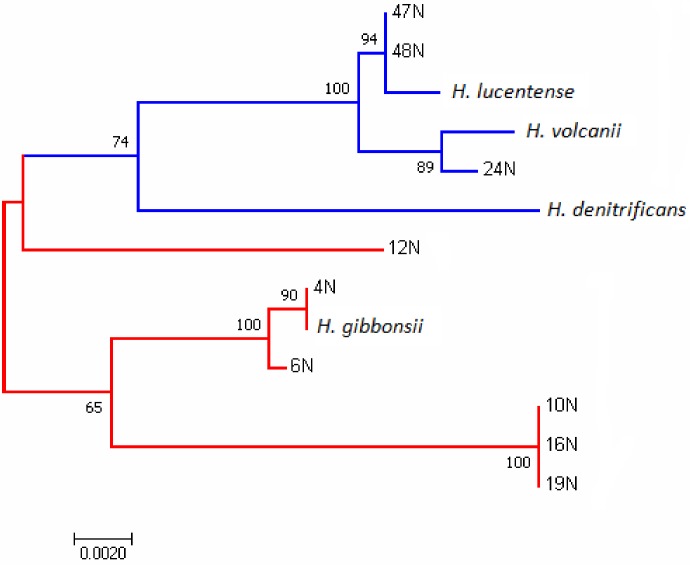
Figure 1.
Molecular phylogenetic analysis of the rpoB1 gene by Maximum Likelihood. Red lines represent species and isolates with an S-layer glycoprotein corresponding to that of H. gibbonsii. Blue lines represent the species and isolates with an S-layer glycoprotein corresponding to the H. volcanii S-layer glycoprotein (see below Section 3.2). The evolutionary history was inferred by using the Maximum Likelihood method based on the Tamura-Nei model [31]. The tree with the highest log likelihood (−3138.94) is shown. The percentage of trees in which the associated taxa clustered together is shown next to the branches. A discrete Gamma distribution was used to model evolutionary rate differences among sites (5 categories (+G, optimized shape parameter = 0.0500)). The rate variation model allowed for some sites to be evolutionarily invariable ((+I), 47.73% sites). The unrooted tree is drawn to scale, with branch lengths measured in the number of substitutions per site. The analysis involved 13 nucleotide sequences. Codon positions included were 1st + 2nd + 3rd. All positions containing gaps and missing data were eliminated. A total of 1827 positions were in the final dataset. Evolutionary analyses were conducted in MEGA7 [30].

