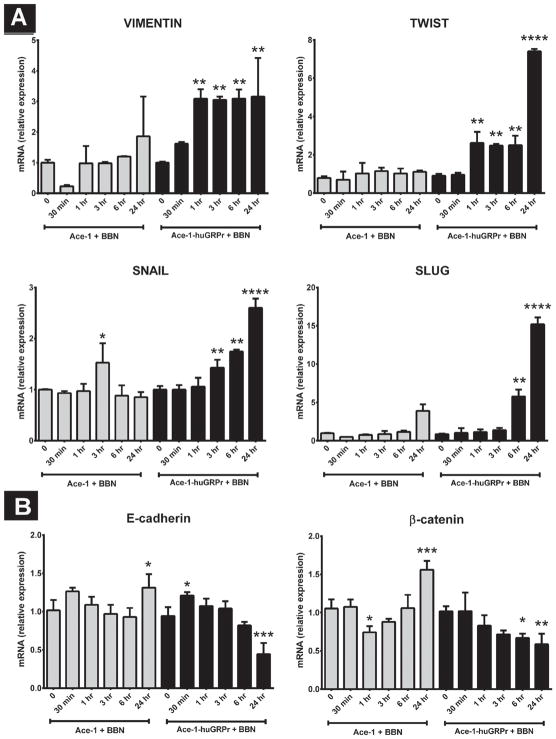
Fig. 5.
The expression of (A) mesenchymal markers (VIMENTIN, SLUG, SNAIL, and TWIST) and (B) epithelial markers (E-cadherin and β-catenin) after treatment with bombesin (BBN). The graphs represent the relative mRNA expression in Ace-1 and Ace-1-huGRPr cells before and after addition of 1nM BBN for different periods of time (0, 30 min, 1, 3, 6, and 24 hr). Significant differences are indicated as: *P≤0.05, **P≤0.01, ***P≤0.001, and ****P≤0.0001 different from control Ace-1 or Ace-1-huGRPr cells.

