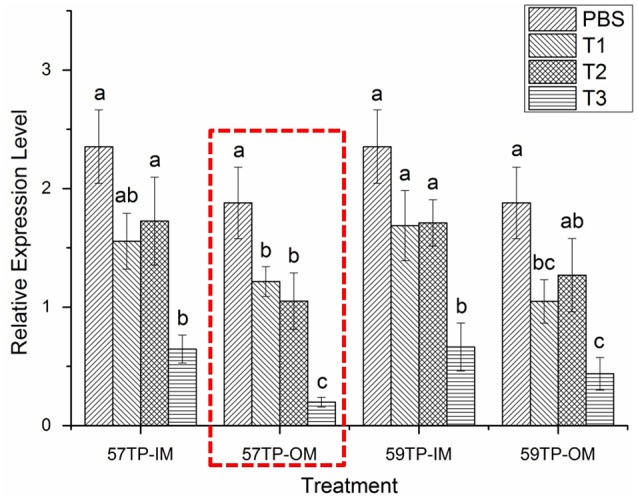
Figure 4.

The mRNA expression levels of CGI_10012534 gene in the in-mantle and out-mantle of oysters after RNAi. Notably, 57TP-IM indicates the siRNA-57 targeted treatment group in the in-mantle, 57TP-OM indicates the siRNA-57 targeted treatment group in the out-mantle, 59TP-IM indicates the siRNA-59 targeted treatment group in the in-mantle, 59TP-OM indicates the siRNA-59 targeted treatment group in the out-mantle, PBS indicates the group treated with PBS (n = 6), T1 indicates the group treated with 5 μg/100 μl siRNA (n = 6), T2 indicates the group treated with 10 μg/100 μl siRNA (n = 6), and T3 indicates the group treated with 15 μg/100 μl siRNA (n = 6). Each bar represents the mean of six independent experiments. Different letters indicate a significant difference (P < 0.05).
