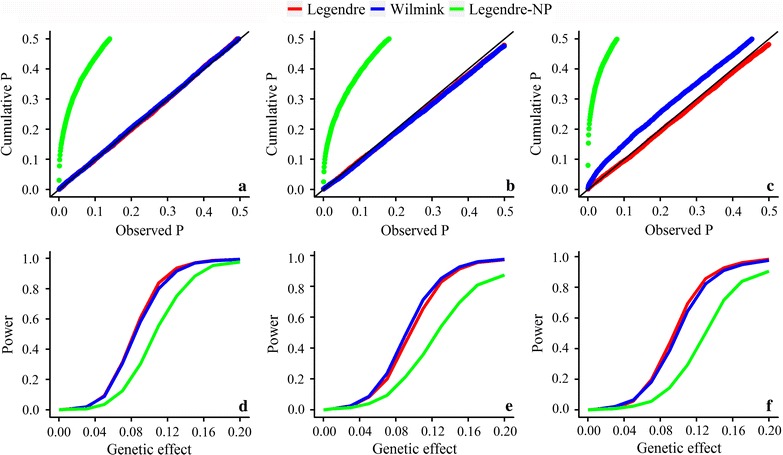
Fig. 3.

Cumulative P-value distributions and empirical power of different models. a–c Cumulative P-value distributions using random SNPs for MY, FP and PP. Under the assumption that random SNPs are unlinked to these traits, models that appropriately control for type I errors should show a uniform distribution of P values. d–f Empirical power of different models for MY, FP and PP. The empirical threshold was determined as the 5th percentile of a null distribution
