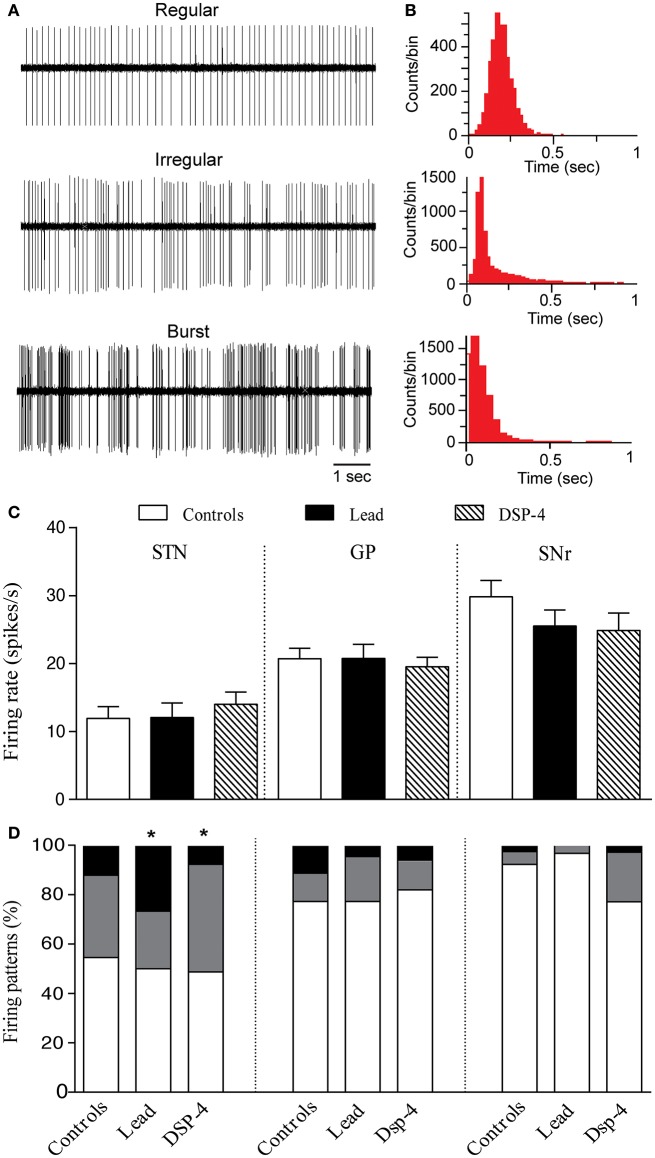
Figure 6.
Effects of lead and DSP-4 treatments on the electrical activity of STN, GP, and SNr neurons. (A) Representative examples of spike trains and the corresponding interspike interval histograms (B) showing regular, irregular and bursty neurons recorded in the STN. (C) Histograms represent the mean ± SEM of the firing rate of all neurons recorded in each experimental group (control, lead, and DSP-4 rats). Firing rate data from control, lead and DSP-4 rats were compared using the one-way ANOVA. (D) Firing pattern histograms showing the proportion (%) of STN, GP and SNr cells discharging regularly (white portion), irregularly (gray portion) or with bursts (black portion). Changes in the proportion of different firing patterns were analyzed using a Chi2 test. *P < 0.05 comparison with controls.

