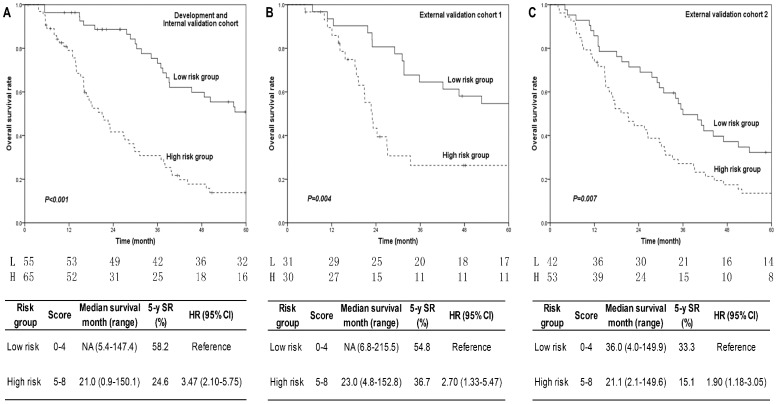
Fig 2.
5-year overall survival curves of different risk groups in three cohorts. Fig. 2A for development cohort, Fig. 2B for external validation cohort 1, and Fig. 2C for external validation cohort 2. P values were shown in each figure. The annual number of patients in low and high risk groups was listed under the figures. Patients in high risk group had shorter median survival time, lower 5-year survival rates, and higher hazard ratios than that in low risk group in all three cohorts. The corresponding results were present in the tables below each figure. P<0.05 was considered statistical significance. Abbreviations: L: low risk group; H: high risk group; SR: survival rate; HR: hazard ratio.

