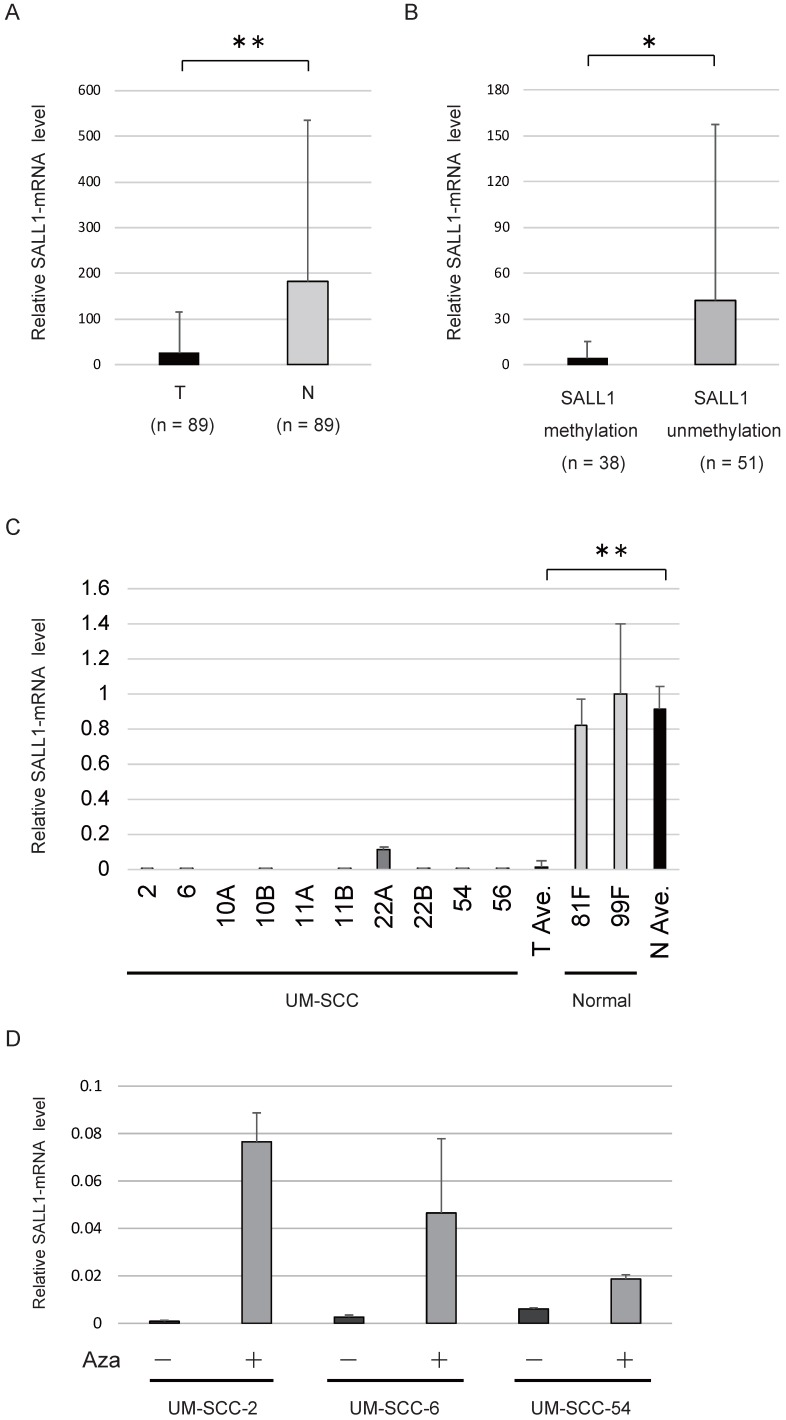
Figure 2.
SALL1 expression as assessed by quantitative reverse transcription PCR (qRT-PCR). (A) Relative mRNA expression level of SALL1 in 89 matched pairs of head and neck tumors and adjacent normal mucosal tissues. T, tumor samples; N, normal samples. ** P < 0.01. (B) SALL1 mRNA expression was inversely correlated with SALL1 hypermethylation. * P < 0.05. (C) Relative mRNA expression level of SALL1, as determined by qRT-PCR in 10 UM-SCC and two normal cell lines. ** P < 0.01. (D) Effect of 5-azacytidine (Aza) on SALL1 expression in three cell lines with densely methylated SALL1, as evaluated by qRT-PCR. Controls were cells that were similarly treated, but without Aza.

