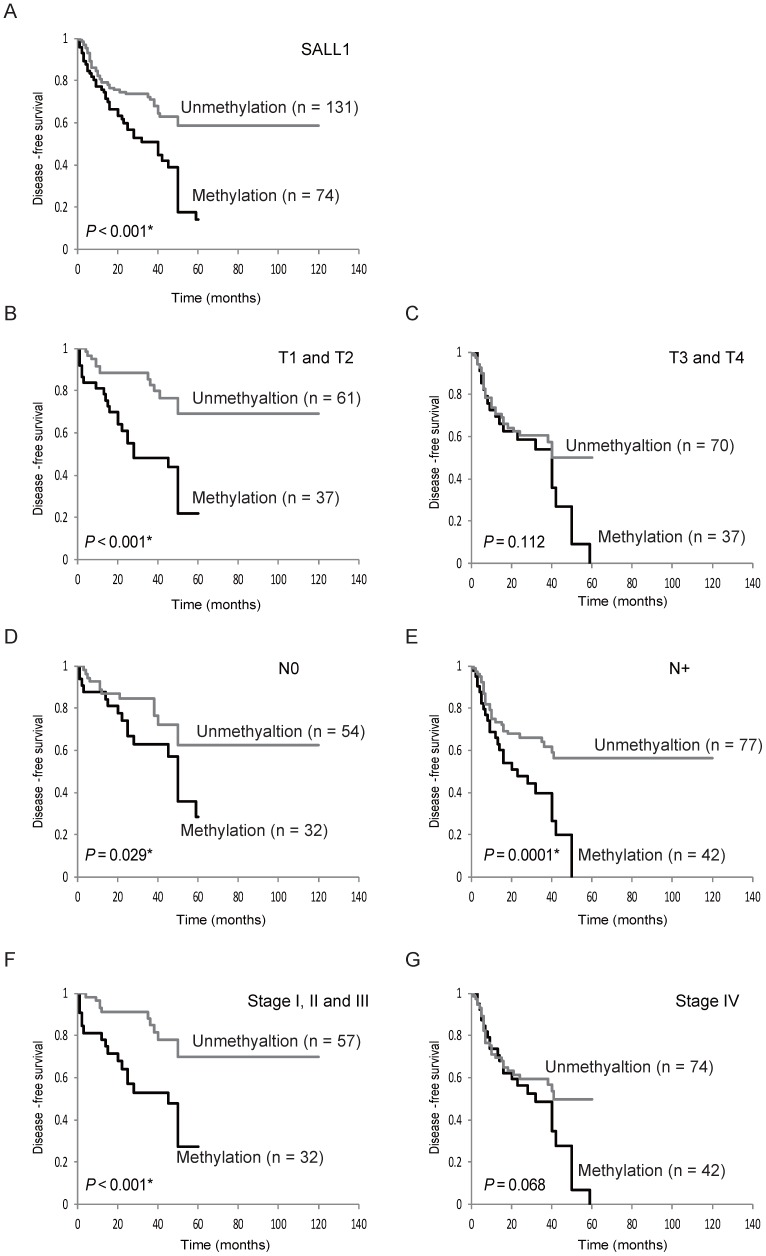
Figure 3.
Kaplan-Meier survival curves for head and neck squamous-cell carcinoma (HNSCC) patients. Disease-free survival (DFS) for (A) all 205 HNSCC cases, (B) tumor size in T1 and T2 cases (n = 98), (C) tumor size in T3 and T4 cases (n = 107), (D) lymph node status in N0 cases (n = 86), (E) lymph node status in N+ cases (n = 119), (F) stage I, II, and III cases (n = 89), and (G) stage IV cases (n = 116). Gray and black lines indicate patients with tumors without and with methylation, respectively.

