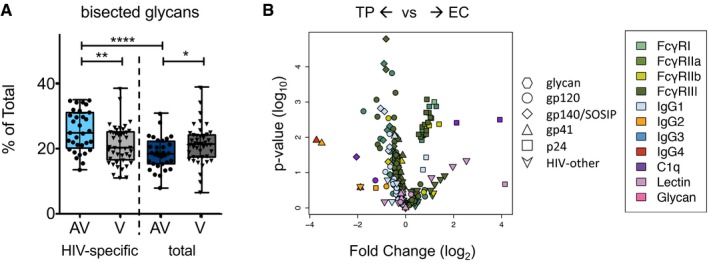
Figure 3. Examples of differentiating humoral response features identified by classification models.

- Level of IgG glycan bisection among HIV‐specific and total plasma IgG in viremic (V) and aviremic (AV) subjects. Boxes and whiskers indicate interquartile range, median, minimum, and maximum values. Significance in differences between groups as defined by an uncorrected two‐tailed unpaired t‐test is indicated as *P < 0.05, **P < 0.005, ****P < 0.0001.
- Volcano plot characterizing the magnitude (fold change) and significance (P‐value) of differences in Fc array measurements between the two types of aviremic subjects, elite controllers (EC) versus treated progressors (TP). Fc array measurements are colored by detection reagent and antigen specificity is indicated by symbol shape.
