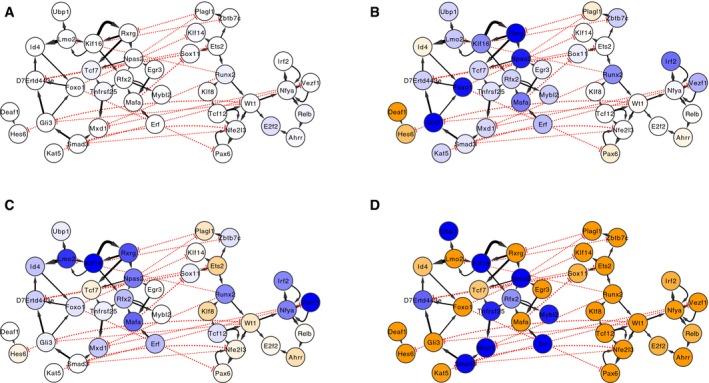
Figure 4. Predicted TF‐to‐TF interactions among 48 putative core regulators of transcriptional changes in mouse models of Huntington's disease.

-
A–DNodes and edges indicate direct regulatory interactions between TFs predicted by the mouse striatum TRN model. Solid black arrows and dotted red arrows indicate positive versus inhibitory regulation, respectively, and the width of the line is proportional to the predicted effect size. Blue and orange shading of nodes indicates that the TF's target genes are overrepresented for downregulated versus upregulated genes in HD mouse models, respectively. If a TF's target genes are enriched in both directions, the stronger enrichment is shown. Each panel indicates the network state in a specific condition: (A) 2‐month‐old Htt Q92/+ mice, (B) 6‐month‐old Htt Q92/+ mice, (C) 2‐month‐old Htt Q175/+ mice, or (D) 6‐month‐old Htt Q175/+ mice.
