
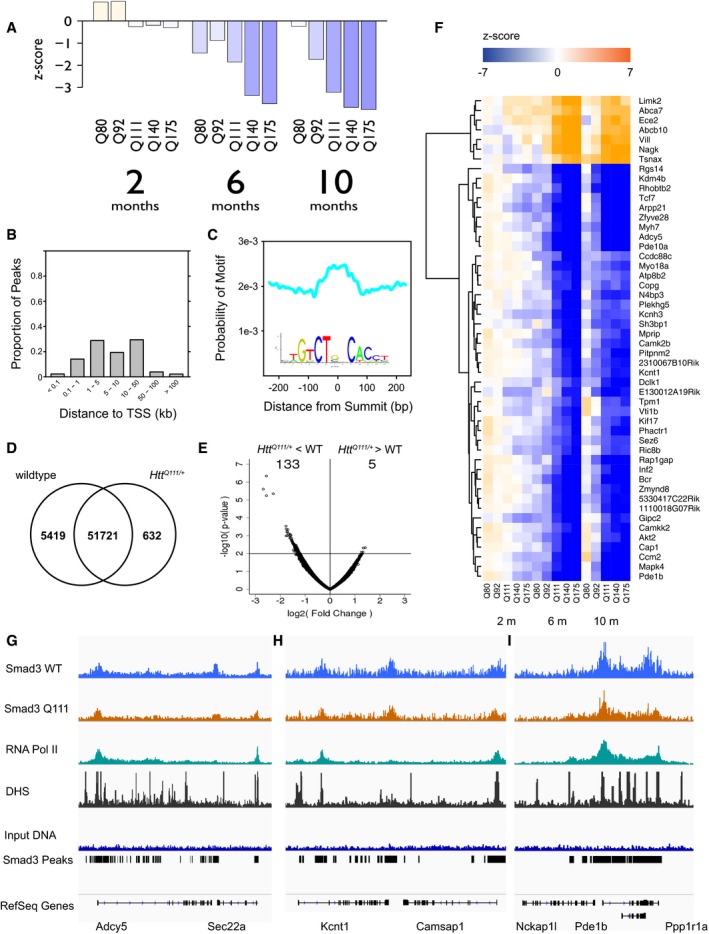
Figure 6. SMAD3 expression, genomic occupancy, and target gene expression in the striatum of HD mouse models.
-
AProgressive age‐ and Htt‐allele‐dependent changes in the expression of SMAD3 in mouse striatum. Bars indicate z‐scores for the expression level in heterozygous mice with each pathogenic Htt allele compared to age‐matched Htt Q20/+ mice.
-
BDistribution of the distances of 57,772 SMAD3 peaks identified by ChIP‐seq to the nearest transcription start site (TSS).
-
CThe summits of SMAD3 peaks are enriched for the sequence motif recognized by SMAD3 (JASPAR CORE MA0513.1, shown in inset).
-
DOverlap between peaks identified in Htt Q111/+ versus wild‐type mice.
-
ESMAD3 occupancy is decreased at a subset of peaks in Htt Q111/+ versus wild‐type mice. x‐axis and y‐axis represent the log2(fold change) and −log10(P‐value), respectively, for each peak region.
-
FAge‐ and Htt‐allele‐dependent expression patterns of the top 50 most strongly differentially expressed SMAD3 target genes.
-
G–IGenomic occupancy of SMAD3 and RNA polymerase II and accessibility of genomic DNA to DNase‐I near (G) Adcy5, (H) Kcnt1, and (I) Pde1b.