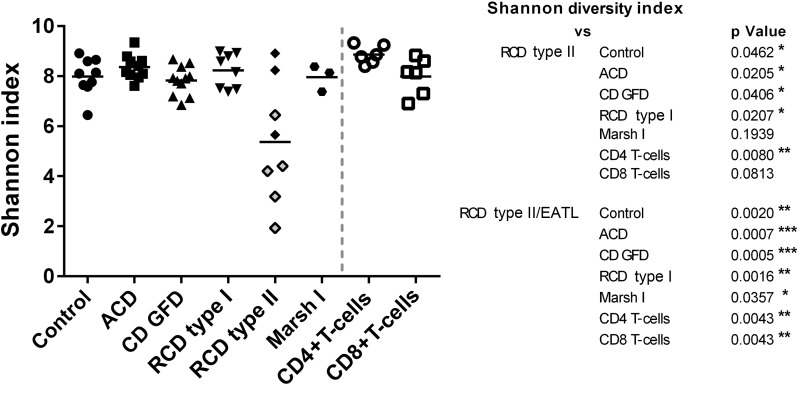
Figure 4.
Dot plot illustrating T-cell repertoire (TCR) diversity of each patient by delineation of corresponding Shannon diversity indices and comparison with peripheral blood CD4+ and CD8+ T-cells. Patients with refractory coeliac disease (RCD) type II/enteropathy-associated T-cell lymphoma (EATL) represents a significant reduced diversity in accordance with any other coeliac disease (CD) subgroup (p>0.05).

