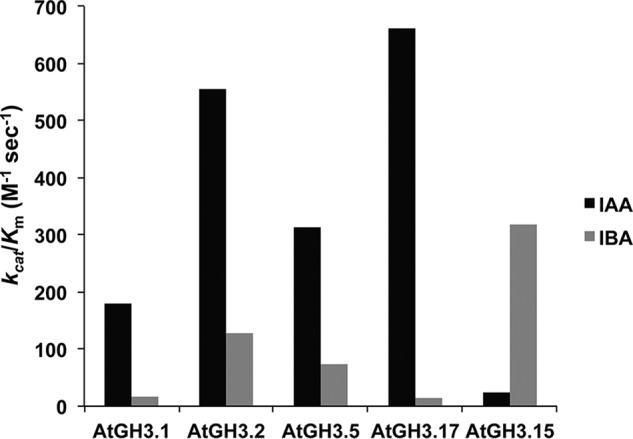
Figure 2.

Comparison of catalytic efficiencies of AtGH3 proteins for IAA and IBA. The kcat/Km values of the indicated AtGH3 proteins with either IAA (black) or IBA (gray) as acyl acid substrates are shown. Values are summaries from the kinetic data in Table 3. IAA data for AtGH3.1, AtGH3.2, AtGH3.5/WES1, and AtGH3.17/VAS2 were published previously (17).
