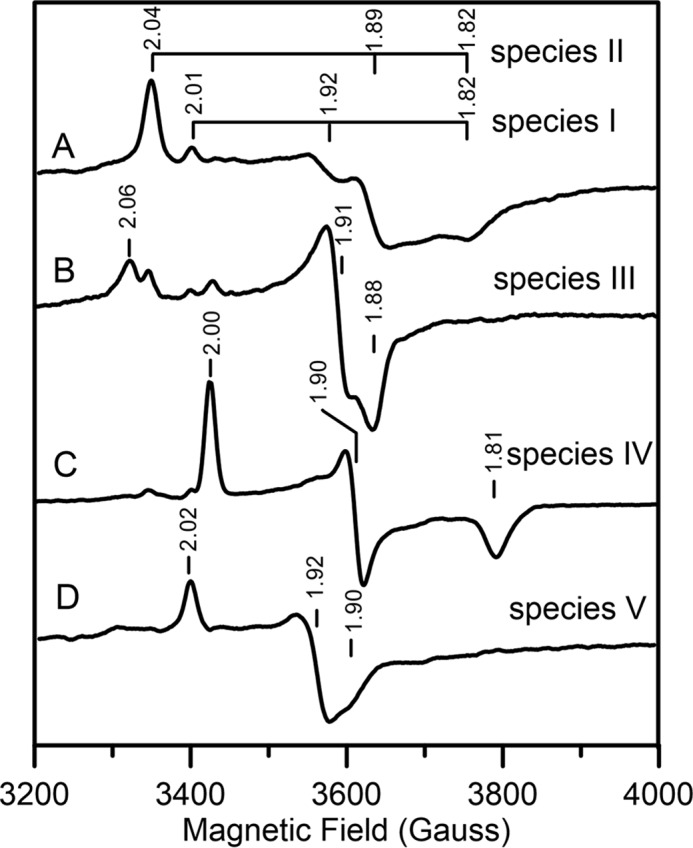
Figure 3.

X-band EPR spectra of reduced [Fe2S2]1+ center in AtDHAD. All spectra presented were recorded at 35 K using 9.60 GHz microwave frequency, 6.4 G modulation amplitude, and a microwave power of 5 mW, except that B used 1 mW microwave power. A, dithionite-reduced DHAD; B, dithionite-reduced DHAD frozen immediately after addition of substrate; C, sample (B) after incubation with substrate at room temperature for 30 min; D, dithionite-reduced DHAD after incubating with DTT. The principal g-values corresponding to the major component(s) in each spectrum are indicated.
