
Figure 5.
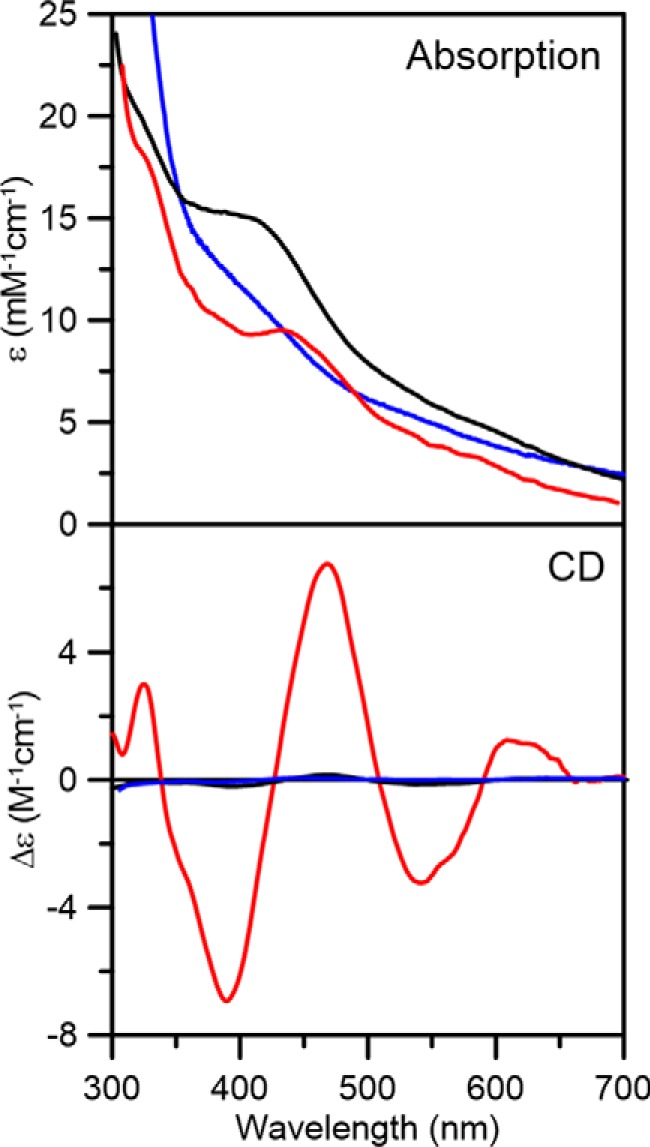
Room temperature UV-visible absorption and CD spectra of reconstituted AtDHAD (black lines), dithionite-reduced reconstituted DHAD (blue lines), and DHAD reconstituted in the presence of NFU2 (red lines). ϵ and Δϵ values were calculated based on the concentration of DHAD monomer.