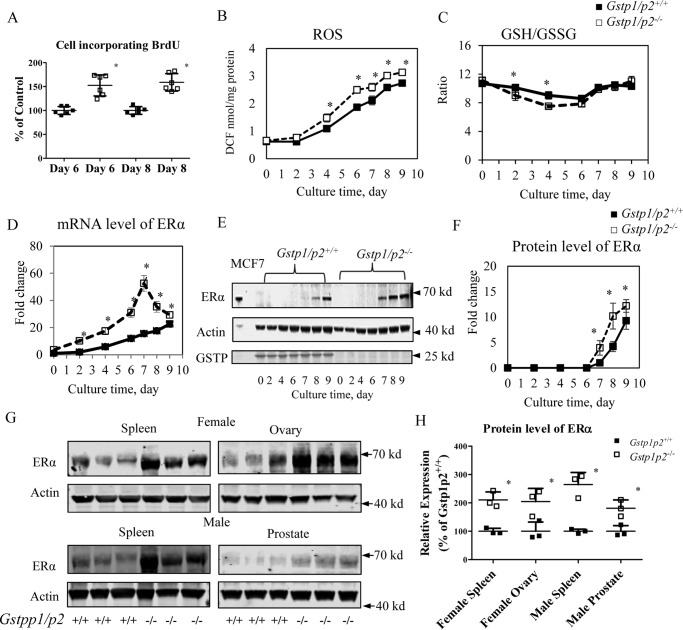
Figure 1.
ERα levels and oxidative stress are higher in Gstp1/p2−/− cells during GM-CSF–driven BMDDC differentiation and proliferation. BM cells were prepared from femora and tibiae from Gstp1/p2−/− or WT mice and cultured in the presence of GM-CSF as described under “Experimental procedures.” Non-adherent cells were collected at days 0, 2, 4, 6, 7, 8, and 9, respectively. A, Gstp1/p2−/− BMDDCs differentiated with GM-CSF had higher proliferation rates. On days 4 and 6, BM cells were seeded at 0.2 × 10⁶ cells/ml in DC medium and cultured for an extra 2 days. Cell proliferation was then assessed by BrdU incorporation. B, cellular ROS levels were measured using a proprietary quenched fluorogenic probe, DCFH-DiOxyQ. C, intracellular GSH levels were measured by thiol fluorescent probe IV after protein precipitation. Intracellular GSSG levels were determined based on the reduction of GSSG in the presence of glutathione reductase and NADPH. Data are presented as GSH/GSSG ratio. D, ERα mRNA levels were determined by quantitative RT-PCR. E and F, ERα protein levels were evaluated by immunoblotting and quantified with Image Studio 4.0 software. The breast cancer cell line MCF7 was used as a positive control for ERα. G and H, Gstp1/p2−/− mice have higher resting tissue levels of ERα. Tissue samples (spleen, ovary, or prostate) were freshly prepared from Gstp1/p2−/− or WT mice. ERα protein levels were evaluated by immunoblotting and quantified with Image Studio 4.0 software. Actin served as a loading control. Data shown are means ± S.D. from three animals. Error bars represent S.D. *, significant differences between Gstp1/p2−/− and WT, p < 0.05. DCF, dichlorofluorescein.

