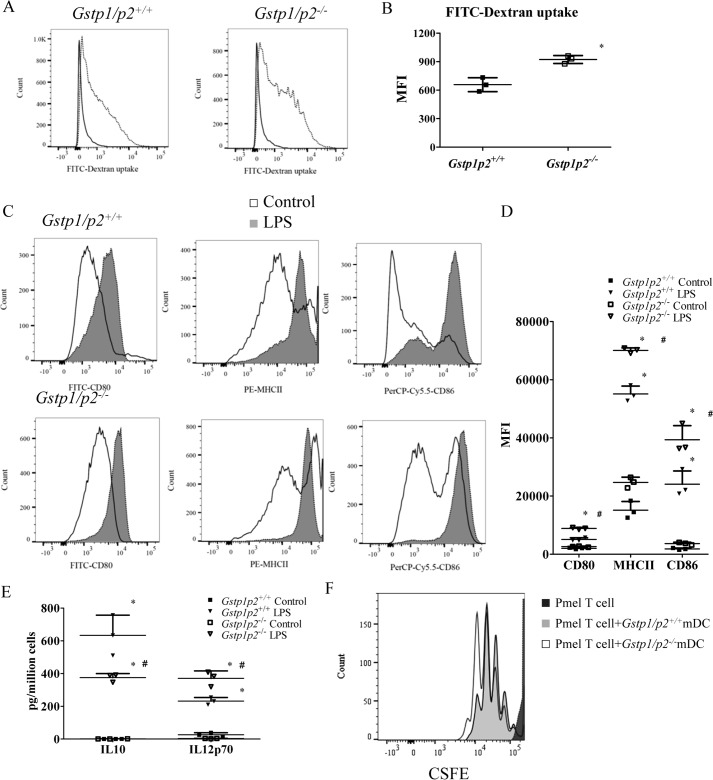
Figure 2.
BMDDCs from Gstp1/p2−/− mice have enhanced antigen presentation functions. A, endocytosis was evaluated by FITC-dextran uptake. BMDDCs from Gstp1/p2−/− or WT mice were pulsed with 1 mg/ml FITC-dextran for 4 h at either 37 or 4 °C and counterstained for markers for DCs (CD11c), T cells (CD3e), B cells (CD45R/B220), monocytes/macrophages (CD14), and NK cells (NK1.1 molecules) before analysis by flow cytometry. Plots are gated on CD11c+, CD3e−, CD45R/B220−, CD14−, and NK1.1− cells. Representative histograms of three experiments are shown. B, FITC-dextran uptake at 37 °C compared with 4 °C (control) shows the mean MFI ± S.D. from three experiments. Error bars represent S.D. *, significant differences between Gstp1/p2−/− and WT imDCs, p < 0.05. C, BMDDCs were cultured in DC medium with or without 200 ng/ml LPS overnight and then analyzed for the expression of maturation markers by flow cytometry. Plots are gated on CD11c+ cells. Data are representative of three experiments. D, quantitative graphical representation of C. Data shown are mean MFI ± S.D. from three experiments. Error bars represent S.D. *, significant differences between control and LPS treatment, p < 0.05; #, significant differences between Gstp1/p2−/− and WT DCs after LPS treatment, p < 0.05. E, BMDDCs from Gstp1/p2−/− or WT mice were stimulated with 200 ng/ml LPS overnight, and medium was removed and examined by ELISA for the proinflammatory cytokine IL-12p70 and the anti-inflammatory cytokine IL-10. Data shown are means ± S.D. of three experiments. Error bars represent S.D. *, significant differences between control and LPS treatment, p < 0.05; #, significant differences between Gstp1/p2−/− and WT DCs after LPS treatment, p < 0.05. F, BMDDCs treated with 200 ng/ml LPS overnight were pulsed with 1 μg/ml hgp100(25–33) peptide in T-cell medium for 2 h and then cocultured with CFSE-labeled, hgp100(25–33)-specific Pmel-1 TCR transgenic T cells (DC/T cell ratio = 1:5) for 3 days. T-cell proliferation by CFSE dilution was measured by flow cytometry. Plots are gated on CD8+ cells. The proliferation profiles shown are representative of three experiments.

