Figure 3.
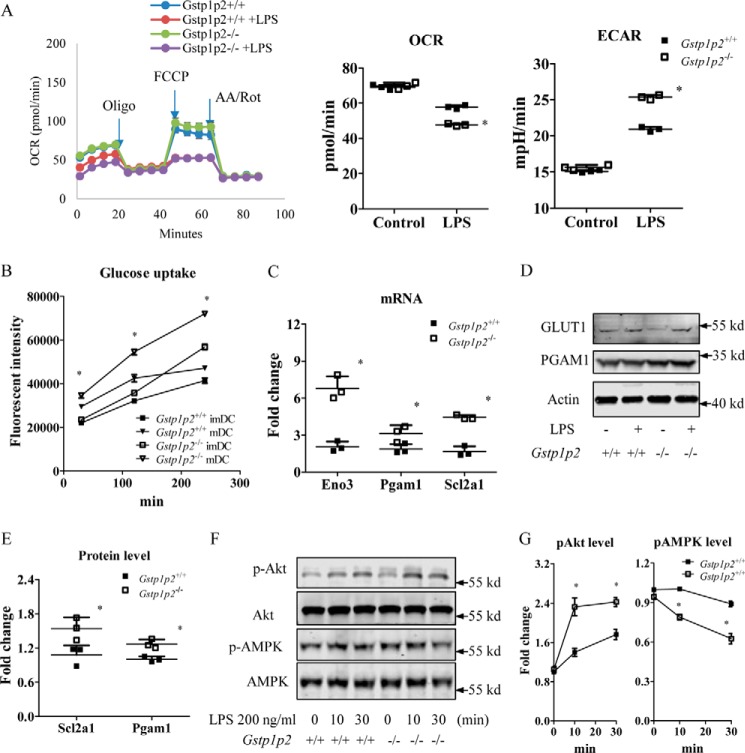
Gstp1/p2−/− BMDDCs are more glycolytic after LPS activation. A, BMDDCs were seeded in a Seahorse XF96 microplate and stimulated overnight with DC medium (as a control) or 200 ng/ml LPS, and real-time OCR during sequential treatments with oligomycin (Oligo; ATP synthase inhibitor), carbonyl cyanide p-trifluoromethoxyphenylhydrazone (FCCP), and antimycin A/rotenone (AA/Rot; electron transport chain inhibitors) and basal OCR and ECAR were determined by the Seahorse XF96 analyzer. Data shown are means ± S.D. of three experiments. Error bars represent S.D. *, significant differences between Gstp1/p2−/− and WT mDCs, p < 0.05. mpH, milliunit of pH value. B, glucose uptake levels were evaluated using the fluorescently labeled deoxyglucose analog 2-NBDG. Data shown are means ± S.D. of three experiments. Error bars represent S.D. *, significant differences between Gstp1/p2−/− and WT mDCs, p < 0.05. C, quantitative RT-PCR analysis of the expression of key genes associated with glycolysis. Data shown are means ± S.D. of three experiments. Error bars represent S.D. *, significant differences between Gstp1/p2−/− and WT mDCs, p < 0.05. D and E, the protein levels of associated genes were further evaluated by immunoblotting with GLUT1, PGAM1, and β-enolase antibodies and quantified with Image Studio 4.0 software. β-Enolase was not detectable in BMDDCs. Results are representative of three experiments. *, significant differences between Gstp1/p2−/− and WT mDCs, p < 0.05. F and G, phosphorylation (p) levels of Akt and AMPK were evaluated by immunoblotting and quantified with Image Studio 4.0 software. Data shown are means ± S.D. of three experiments. Error bars represent S.D. *, significant differences between Gstp1/p2−/− and WT DCs, p < 0.05.

