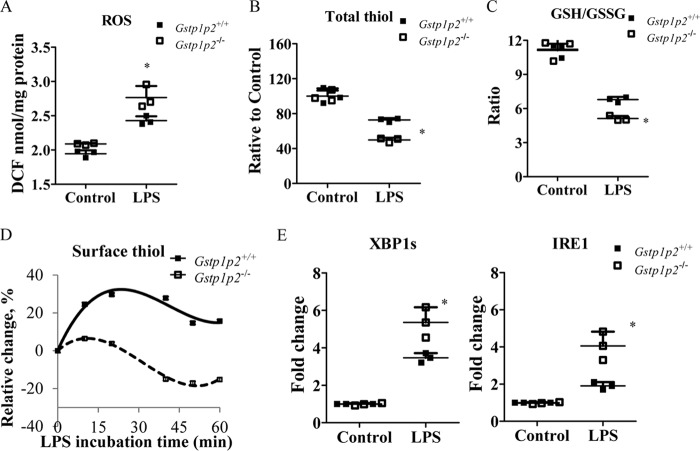
Figure 4.
BMDDCs from Gstp1/p2−/− mice have higher levels of oxidative stress and UPR during LPS activation. A, cellular ROS levels were measured using a proprietary quenched fluorogenic probe, DCFH-DiOxyQ. B, intracellular reduced thiol levels were measured by thiol fluorescent probe IV. C, intracellular GSH levels were measured by thiol fluorescent probe IV after protein precipitation. Intracellular GSSG levels were determined based on the reduction of GSSG in the presence of glutathione reductase and NADPH. Data are presented as GSH/GSSG ratio. D, total surface reduced thiol levels were determined by an immediate fluorescence increase upon addition of ThioGlo-1. E, UPR genes IRE1 and XPB1s were quantified by quantitative RT-PCR. Data shown are means ± S.D. of three experiments. Error bars represent S.D. *, significant differences between Gstp1/p2−/− and WT after LPS treatment, p < 0.05. DCF, dichlorofluorescein.

