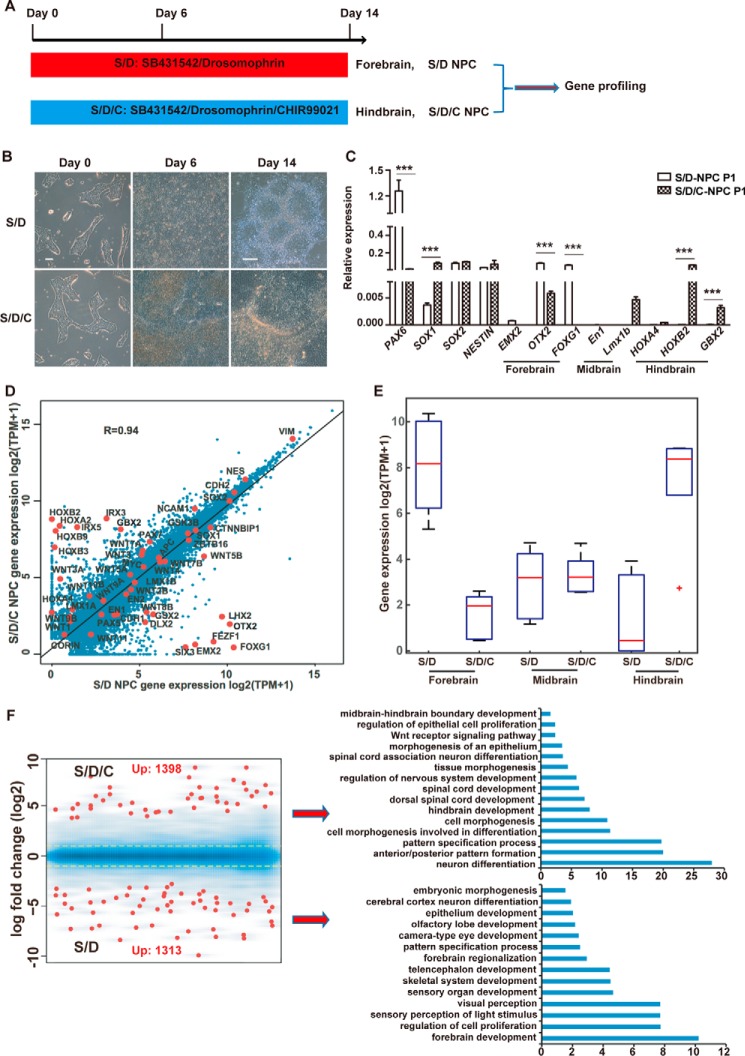
Figure 1.
Differentiation of forebrain or hindbrain NPCs from hPSCs. A, schematic of neural differentiation protocols to induce forebrain and hindbrain NPCs from hPSCs. B, cell morphologic of hPSCs treated with SD or SDC at the indicated times. Scale bars = 100 μm. C, QPCR analysis of the indicated marker genes in SD- or SDC-treated cells. D, Pearson correlation of the whole-genome transcriptome between SDC NPCs and SD NPCs. The red dots represent the expression levels of the indicated marker genes. The R value represents Pearson's correlation coefficient. E, box plot of the RNA levels of selected marker genes based on RNA sequencing data. F, gene ontology analysis of the differentially expressed genes in SD- and SDC-treated cells. Yellow lines correspond to a 2-fold change. ***, p < 0.001.

