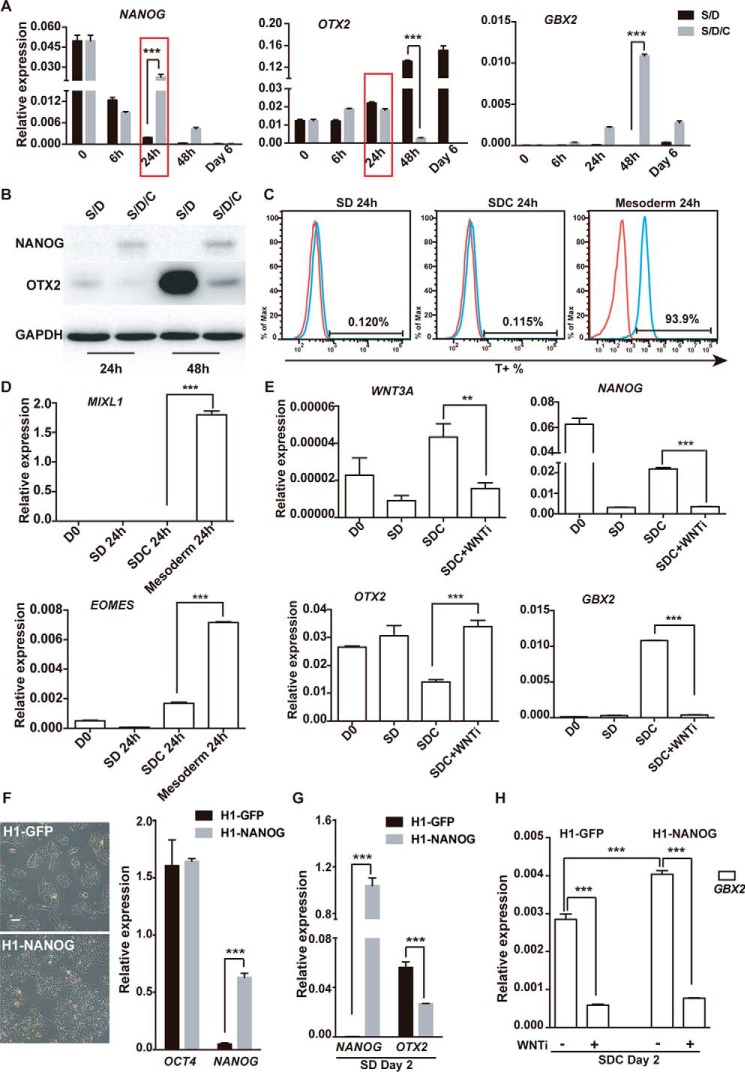
Figure 4.
GSK3β inhibition sustains NANOG and suppresses OTX2 in hPSC differentiation. A, QPCR analysis of the indicated genes in time course experiments of SD- or SDC-treated hPSC differentiation. B, Western blot analysis of NANOG and OTX2 in time course experiments of SD- or SDC-treated hPSC differentiation at 24 h and 48 h. GAPDH served as the loading control. C and D, the primitive streak markers T, MIXL1, and EOMES were analyzed through FACS and QPCR. E, expression of WNT3A and NANOG in hESCs treated with SD, SDC, and SDC with WNT inhibitor at 24 h of differentiation. F, cell morphology and QPCR analysis of H1 ESCs with NANOG or GFP overexpression. Scale bar = 100 μm. G, expression of OTX2 in H1 hESCs with NANOG or GFP overexpression treated with SD or SDC. H, expression of GBX2 in hESCs with NANOG or GFP overexpression treated with SDC with or without WNT inhibitor. **, p < 0.01; ***, p < 0.001.

