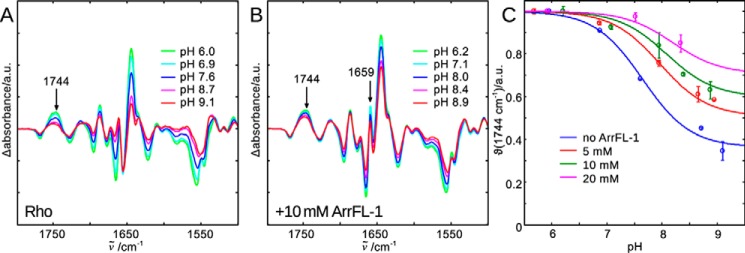
Figure 2.
FTIR difference spectra of rhodopsin light activation in the native membrane and at different pHs are recorded to illuminate the different agonist-bound receptor conformations in equilibrium (Scheme 1). A, lowering the bulk pH causes E3.49 protonation and disruption of the E3.49-R3.50 ionic lock (23), which leads to stabilization of the active R*H+ conformation and an intensity increase of difference bands indicating activating structural changes. The band at 1744 cm−1 is a suitable monitor of the active conformations R* and R*H+ and it is isolated from other changing absorbance bands. B, addition of 10 mm ArrFL-1 leads to several additional difference bands (e.g. 1659 cm−1). It also stabilizes the active conformation, because even at high pH the intensity of the 1744 cm−1 marker band reflects predominantly active conformation formed. C, evaluation of 1744 cm−1 intensity changes as a function of pH and ArrFL-1. With increasing ArrFL-1 concentration an upshift of the apparent pKa of proton uptake and an increase of the alkaline end point level are observed, which indicates stabilization of R* and R*H+ because of ArrFL-1 binding. For each pH value two datasets have been acquired independently and averaged, the deviation is shown as error bar.

