
Figure 8.
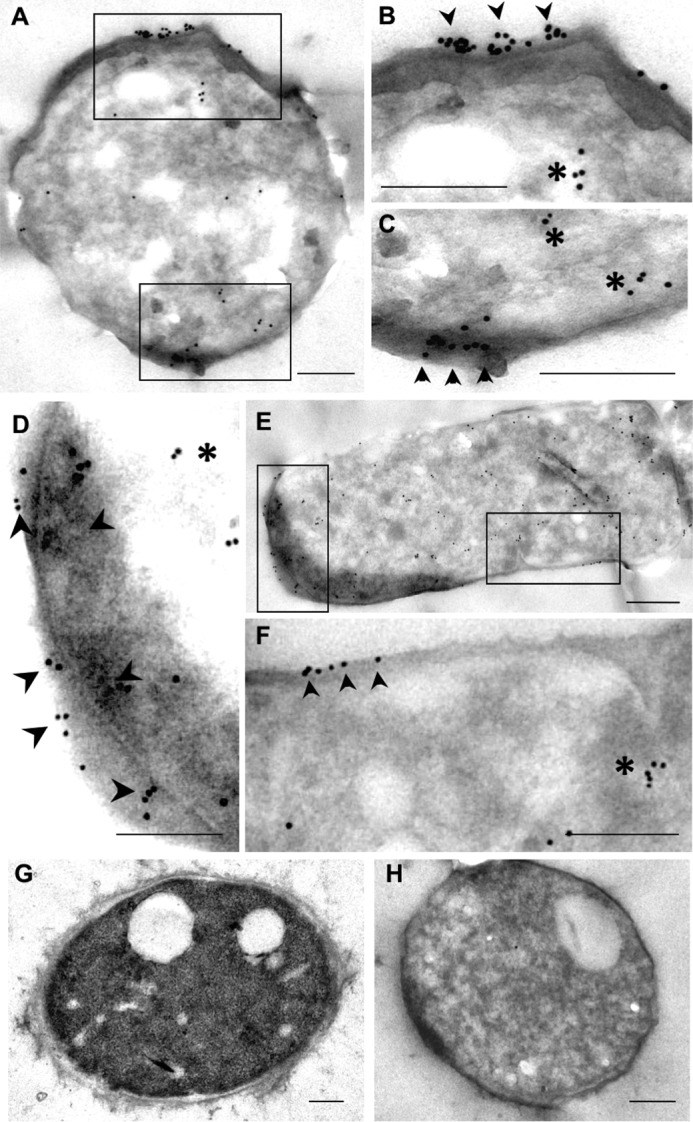
IEM localization of ENO1 in C. albicans. Micrographs A–C and D–F correspond to low and high magnifications of two sets of yeasts processed for immuno-gold labeling for detection of ENO1. G corresponds to a yeast processed to preserve general ultrastructure. H corresponds to the negative control incubated with normal rabbit serum. Scale bar, 0.2 μm.