
Figure 6.
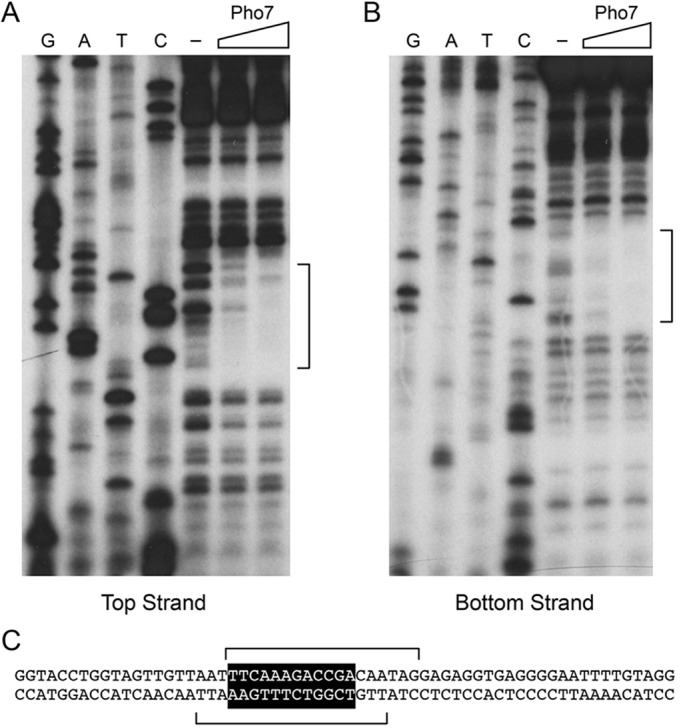
Footprinting of a high-affinity Pho7 site in the pho84 promoter. DNase I footprinting analyses of the top strand (A) and bottom strand (B) of the pho84 promoter fragment from −1039 to −907 nt upstream of the transcription start site are shown along with the respective sequencing ladders. Binding reaction mixtures contained 0.25 pmol of 5′ 32P-labeled DNA and either no added Pho7-DBD (lanes −) or increasing amounts of Pho7-DBD (5 or 10 ng). The margins of the footprints are indicated by brackets. DNA sequence from −1008 to −947 upstream of the pho84 transcription start site is shown in C. The Pho7-binding motif is shown in white font on black background. The brackets denote the DNase I footprints on the top and bottom strands.