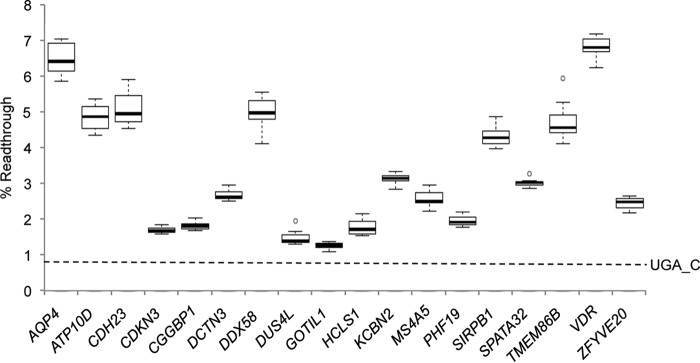
Figure 1.
Readthrough efficiencies of human UGA_CUAG stop codons. Readthrough efficiencies were determined by dual luciferase assay after transfection of HEK293T cells with dual luciferase reporter constructs consisting of candidate sequences (6 nt 5′ and 12 nt 3′ of stop codon (9 nt 3′ for MS4A5 because of an in-frame stop codon)) shown in Table S1. AQP4 readthrough has been described previously (17, 21) and is included here as an internal readthrough control. A UGA_C control indicated by a dashed line represents background readthrough levels. In each box-whisker plot center lines show the medians; box limits indicate the 25th and 75th percentiles as determined by R software; whiskers extend 1.5 times the interquartile range from the 25th and 75th percentiles; outliers are represented by dots. n = 12 biological replicates.

