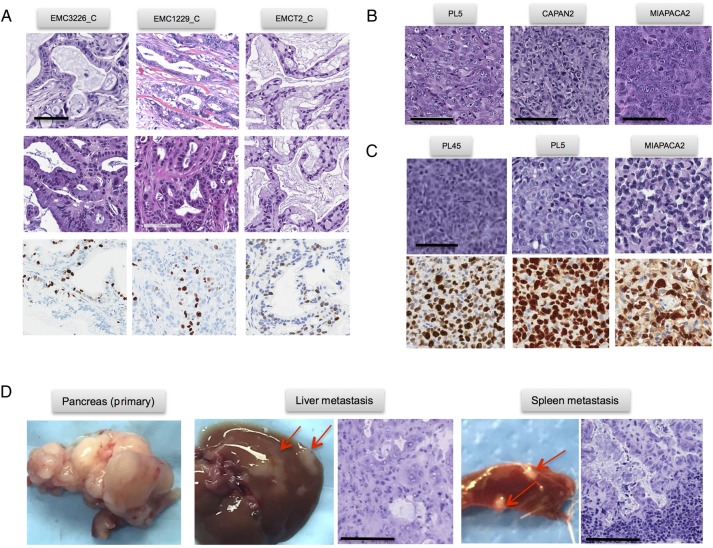
Figure 3.
Phenotypic features of patient-derived models. (A) Representative images of orthotopically injected patient-derived cell lines. H&E and Ki67 staining are shown, scale bar is 100 µm. (B and C) Representative images of orthotopically injected established cell lines. H&E and Ki67 staining are shown, scale bar is 100 µm. (C) Orthotopic patient-derived xenograft (PDX) model showing the metastatic spread to liver and spleen. Scale bar is 100 µm.

