Figure 7.
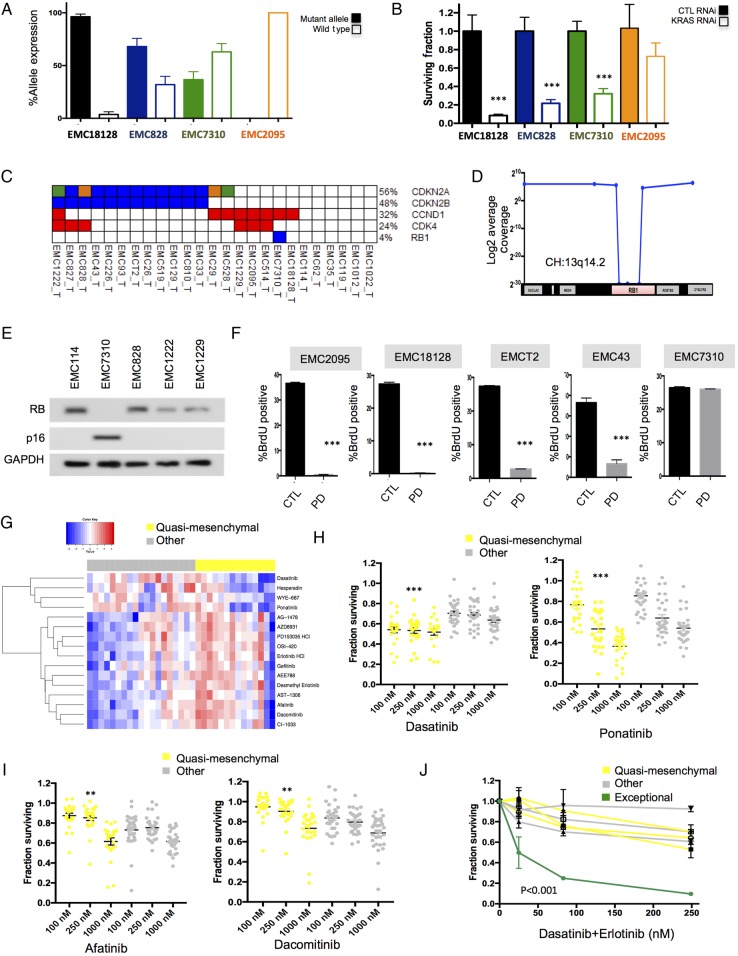
Defining tumour selective sensitivity profiles. (A) The expression of the mutant and wild-type KRAS allele was determined by analysis of RNA sequencing data. These data revealed three principle forms of expression. Those solely expressing mutant KRAS (black bars), those biased towards mutant KRAS (blue bars) and those with approximately equal expression of both wild-type and mutant KRAS (green bars). All data are from triplicate RNA sequencing, the mean and SD are shown. (B) The knockdown of KRAS was performed in models exhibiting various KRAS expression patterns. The surviving fraction was determined by cell-titre glow (n=5). Data show the average and SD. Data were statistically significant as determined by unpaired t-test, ***p<0.001. (C) Alterations of genes in RB pathway. (D) Schematic of 13q14.2 locus and the intragenic deletion of RB1 in the case EMC7310. (E) Immunoblotting for RB, p16ink4a and GAPDH in the indicated cell lines. (F) Flow cytometry analysis of the response to PD-0332991 in the indicated cell lines. Mean and SD of BrdU-positive cells is shown (n=3). Data were statistically significant as determined by unpaired t-test, ***p<0.001. (G) Heatmap of the area under the curve of drug sensitivity to the indicated agents in quasi-mesenchymal subtype versus other patient-derived cell lines. (H and I) Scatter plots of drug sensitivity of quasi-mesenchymal subtype versus other patient-derived cell lines for the indicated agents. **p<0.01, ***p<0.001 determined by two-way analysis of variance. (J) Dose-response for the indicated cell lines with the dasatinib+erlotinib at the indicated concentrations.

