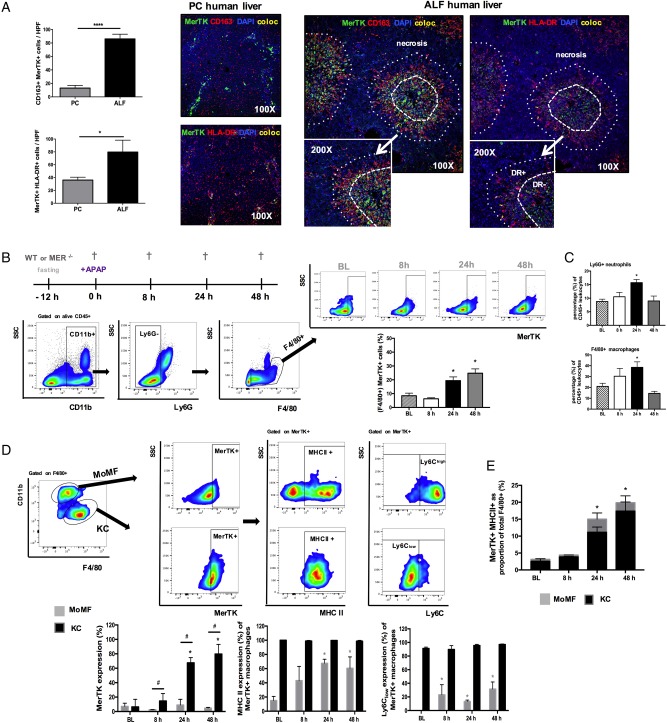
Figure 3.
Mer tyrosine kinase (MerTK)+ hepatic macrophages are expanded in human and experimental APAP-induced acute liver injury. (A) Representative confocal images for MerTK (green), CD163 (red), HLA-DR (red), DAPI (blue) and colocalisation (yellow) in pathological control (n=4) and acute liver failure (ALF) (n=6) human liver tissue (100×, inset 200×). Data show enumeration of CD163+MerTK+ and MerTK+HLA-DR+ cells in centrilobular areas of pathological control (PC, n=4) and ALF (n=6) liver. (B–E) Wild-type (WT) mice dosed with APAP were studied at 8, 24 and 48 hours, while untreated mice served as baseline controls (n=4/group). (B) Schematic of experimental dosing, representative flow cytometry analysis and gating strategy used to identify F4/80+ hepatic macrophages and determine their MerTK expression levels. (C) Ly6G+ neutrophils and F4/80+ macrophages as percentage (%) of total liver CD45+ leucocytes, as determined by flow cytometry. (D) Representative flow cytometry gating strategy used to identify (CD11blowF4/80high)-resident Kupffer cells (KC) and (CD11bhighF4/80low) monocyte-derived macrophages (MoMF) to determine their MerTK expression. Further subanalysis examined the MHC class II and Ly6C expression levels of MerTK+ macrophages in both MoMF (grey bars) and KC (black bars) subpopulations. (E) Data show MerTK+MHCII+ macrophages as proportion of total F4/80+ cells and the relative contribution of MoMF (grey) or KC (black). Non-parametric (Mann-Whitney) statistical analysis was used. Data are presented as median values with IQR. * or #p<0.05, **p<0.01, ****p<0.0001.

