
Figure 2.
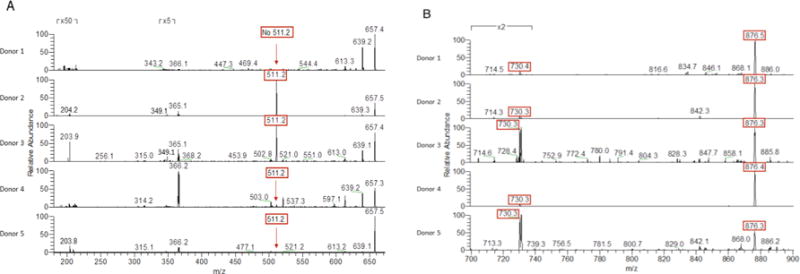
MALDI-FT-ICR-MS/MS spectra of (A) m/z 657.2 and (B) m/z 1022.2 from 700-900 of HMOs from 5 separate donors obtained in the positive ion mode. Diagnostic peaks highlighted in red.
Official websites use .gov
A
.gov website belongs to an official
government organization in the United States.
Secure .gov websites use HTTPS
A lock (
) or https:// means you've safely
connected to the .gov website. Share sensitive
information only on official, secure websites.
MALDI-FT-ICR-MS/MS spectra of (A) m/z 657.2 and (B) m/z 1022.2 from 700-900 of HMOs from 5 separate donors obtained in the positive ion mode. Diagnostic peaks highlighted in red.