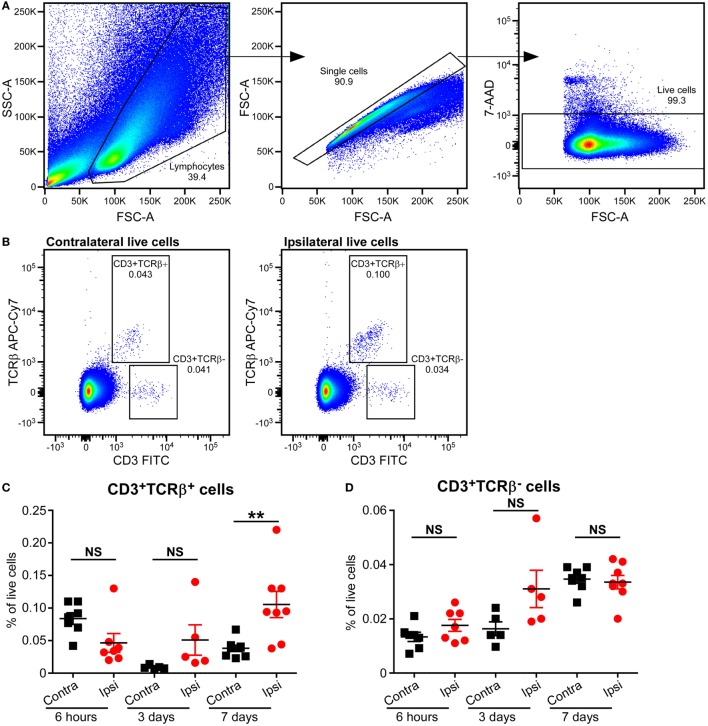
Figure 3.
Increased CD3+TCRβ+ T cells in the mouse brain after hypoxia–ischemia (HI). (A,B) Representative flow cytometry plots showing the gating strategy (A) and presence of CD3+TCRβ+ and CD3+TCRβ− cells in the contralateral and ipsilateral hemispheres (B) 7 days after HI. (C,D) The percentage of CD3+TCRβ+ (C) and CD3+TCRβ− (D) cells within the live cell population in the ipsilateral (Ipsi) and contralateral (Contra) hemispheres of mouse brains at 6 h (n = 6), 3 days (n = 5), and 7 days (n = 8) post-HI. **p < 0.01 using Student’s paired t-test. Data are presented as the mean ± SEM.

