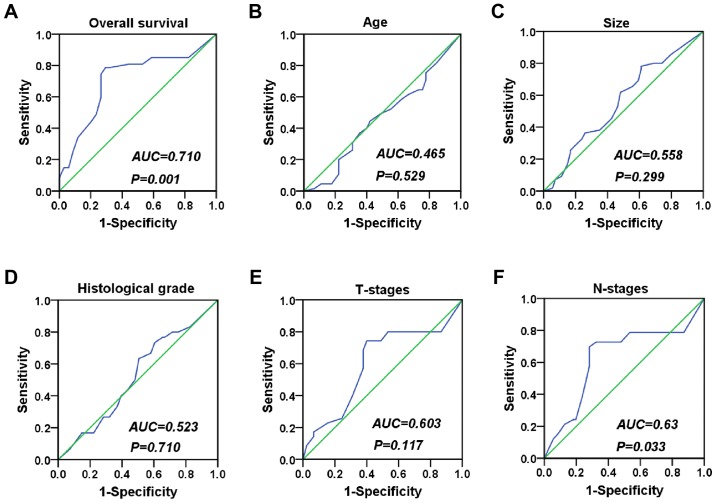
Figure 2.
ROC curve analysis of clinicopathological features. (A) The ROC curve depicting patient survival exhibited the largest area under the curve (P=0.001), and thus we used this ROC curve to obtain a cutoff value. (B-F) ROC curves of other clinicopathological features. ROC, receiver operating characteristic.

