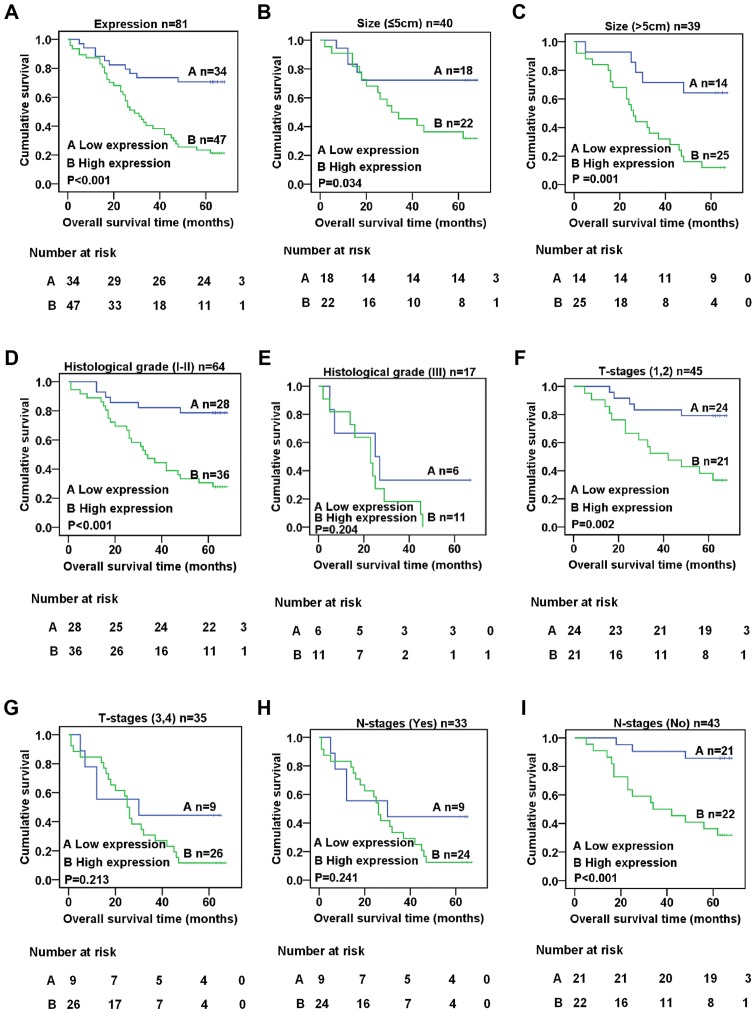
Figure 4.
Kaplan-Meier analysis of overall survival with regard to patient clinicopathological features. (A) Kaplan-Meier analysis of the overall survival rate of patients expressing XLOC_010588 (P<0.001). (B and C) Association between the expression level of XLOC_010588 and patient prognosis when tumor size was (B) ≤5 cm (P=0.001) or (C) >5 cm (P=0.034). (D and E) Association between the expression level of XLOC_010588 and patient prognosis when tumor histological grade was (D) I–II (P<0.001) or (E) III (P=0.204). (F and G) Association between the expression level of XLOC_010588 and patient prognosis when tumor T-stage was (F) 1–2 (P=0.002) or (G) 3–4 (P=0.213). (H and I) Association between the expression level of XLOC_010588 and patient prognosis when lymph node metastasis was (H) present (P=0.241) or (I) absent (P<0.001).

