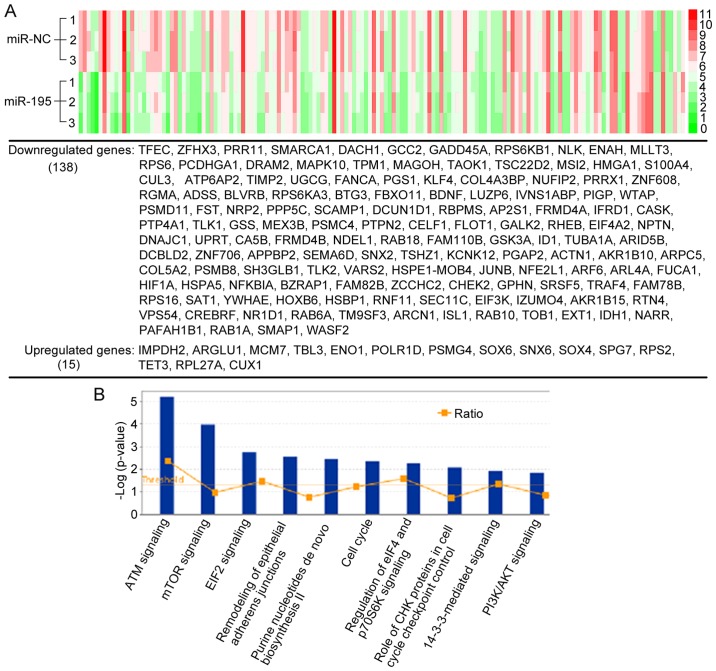
Figure 2.
Analysis of RNA-based microarray following miR-195 overexpression. (A) Supervised hierarchical clustering of the genes significantly differentially expressed after miR-195 overexpression in LNCaP cells (fold changes ≤-1.5 or ≥1.5). (B) Top 10 enriched KEGG pathways associated with the differentially expressed genes induced by miR-195.

