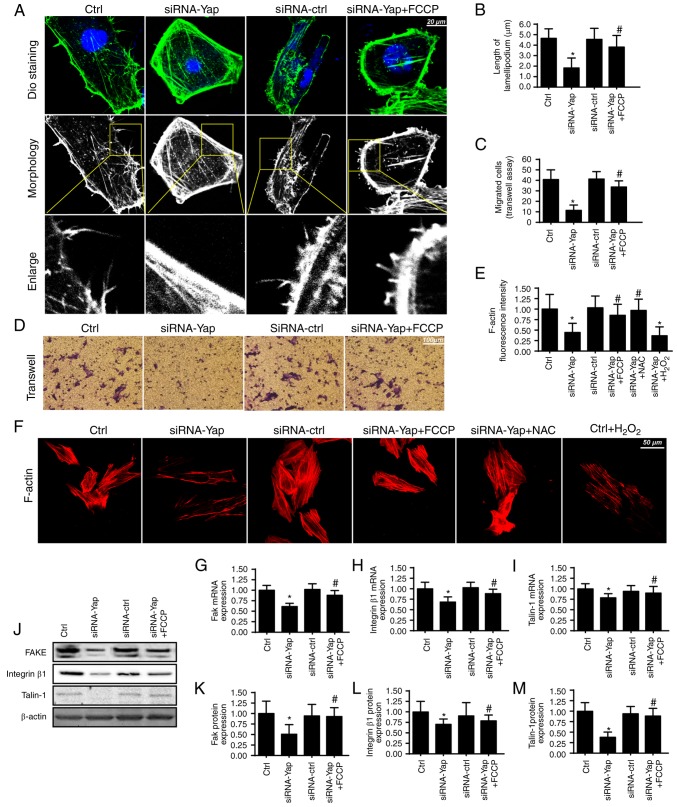
Figure 3.
Mitophagy regulates F-actin homeostasis and cancer migration. (A and B) The change in cancer cell lamellipodia. The cellular membrane dye DiO was used to label the lamellipodia in the cellular membrane. Meanwhile, the white and black image was acquired and was amplified to observe the length of lamellipodia. (C and D) The change in cellular migration via Transwell assay. (E and F) The lamellipodia were formed by the F-actin. The F-actin antibody was used to observe the change in F-actin intensity. (G-I) The mRNA change in adhesive proteins of FAK, integrin β1 and Talin-1. (J-M) The change in FAK, integrin β1 and Talin-1 at the protein level. *P<0.05 vs. the Ctrl group, #P<0.05 vs. the siRNA-Yap group. Yap, Yes-associated protein.

