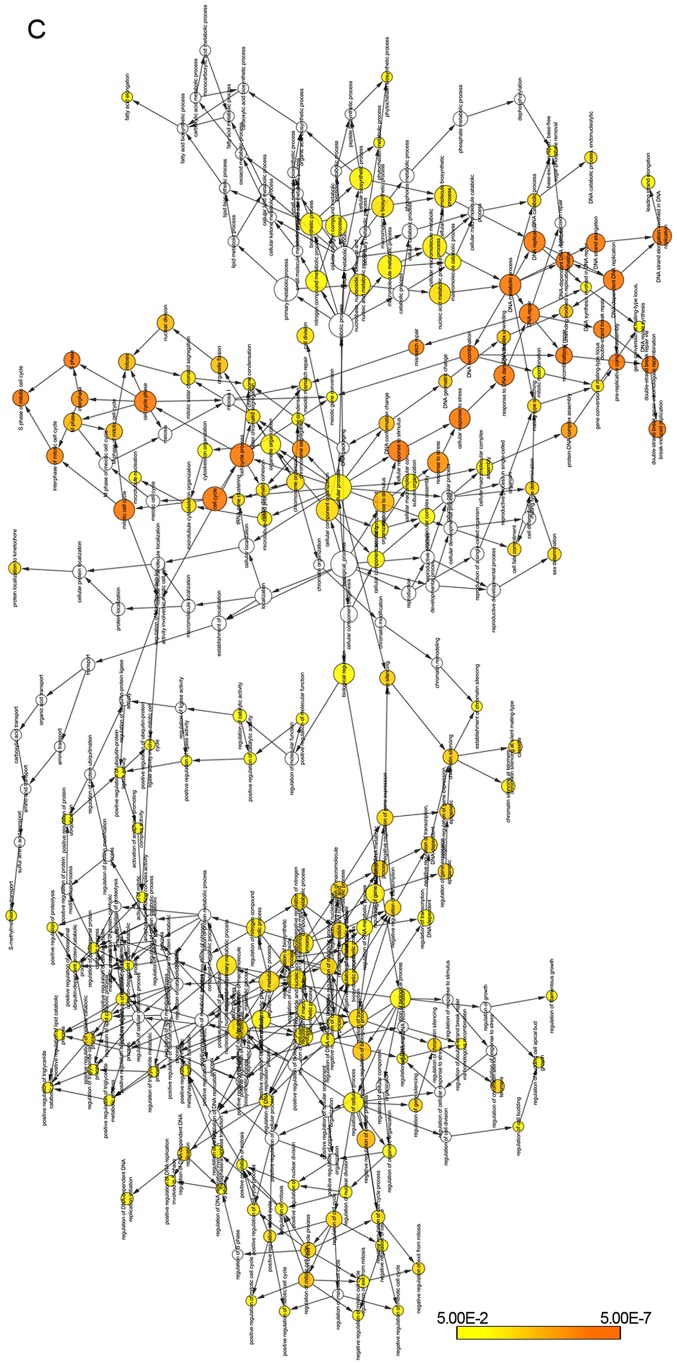
Figure 6.
(A) Venn diagrams of DEGs between the high HURP expression group and low HURP expression group extracted from GSE30219, GSE68465 and TCGA-Provisional. (B) KEGG pathways enriched for DEGs were mainly cancer-related pathways. (C) The GO biological terms enriched by DEGs were performed by BiNGO plugin for Cytoscape. DEGs, differentially expressed genes.


