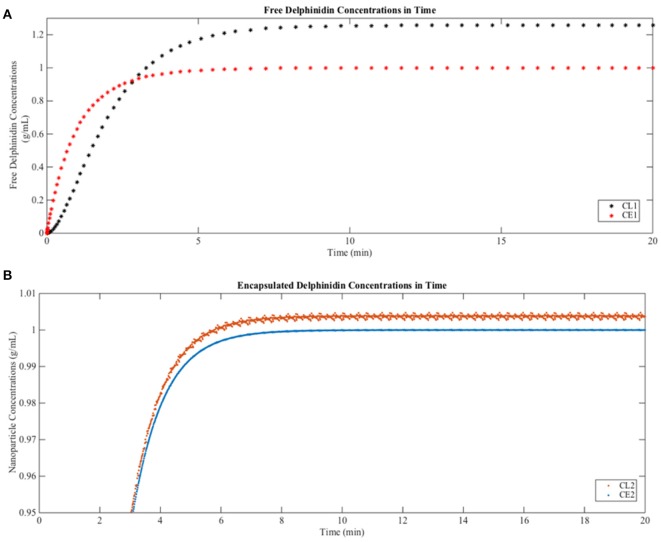
Figure 6.
Predictions of free and encapsulated delphinidin delivery to brain tissue (A) Free delphinidin concentration vs. time graph where y-axis 0–1.3. (B) Encapsulated delphinidin concentration vs. time graph where y-axis 0.95–1.01. CL, concentration in the lumen; CE, concentration in the endothelial cells of the barrier.

